Validation of ice thickness - Full domain
Bulletin date: 2019-04-11
Model: ARC MFC - TOPAZ
Data source: UCL CryoSAT-2 sea ice thickness
Validation statistics summary
| Bias (m) | RMS (m) | total grids | low SIT | OK SIT | high SIT | |
|---|---|---|---|---|---|---|
| Best estimate | -1.01 | 1.15 | 47423 | 22148 | 25184 | 91 |
| Day 1 forecast | -1 | 1.14 | 47423 | 21614 | 25707 | 102 |
| Day 4 forecast | -1 | 1.14 | 47423 | 21573 | 25748 | 102 |
| Day 7 forecast | -0.99 | 1.13 | 47423 | 21213 | 26110 | 100 |
| Day 10 forecast | -0.97 | 1.11 | 47423 | 20461 | 26862 | 100 |
Numbers in the three rightmost columns are grid counts. Regions with high/low sea ice thickness correspond to areas with model offsets from the gridded observations outside of one standard deviation. (Standard deviations are provided in the observational product.)
Definition of categories:
| Category | Sea ice thickness |
|---|---|
| c1 | <1m |
| c2 | 1 - 1.5m |
| c3 | 1.5 - 2m |
| c4 | 2 - 2.5m |
| c5 | 2.5 - 3m |
| c6 | >3m |
Best estimate vs. observations
Contingency table
| observations | |||||||||
|---|---|---|---|---|---|---|---|---|---|
| open | c1 | c2 | c3 | c4 | c5 | c6 | |||
| m o d e l |
open | 0 | 0 | 0 | 0 | 0 | 0.001 | 0.001 | |
| c1 | 0 | 0.004 | 0.058 | 0.136 | 0.062 | 0.017 | 0.01 | ||
| c2 | 0 | 0 | 0.006 | 0.097 | 0.174 | 0.049 | 0.011 | ||
| c3 | 0 | 0 | 0.003 | 0.041 | 0.107 | 0.073 | 0.03 | ||
| c4 | 0 | 0 | 0.001 | 0.001 | 0.005 | 0.022 | 0.058 | ||
| c5 | 0 | 0 | 0 | 0 | 0 | 0.001 | 0.027 | ||
| c6 | 0 | 0 | 0 | 0 | 0 | 0 | 0.004 | ||
See category definitions for details.
Statistical distribution
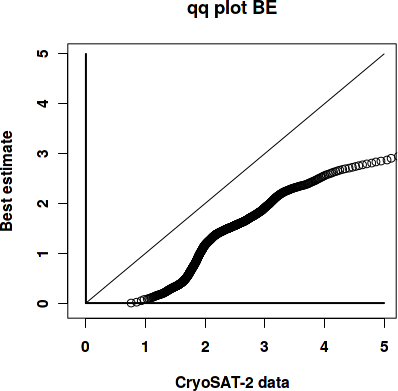
|
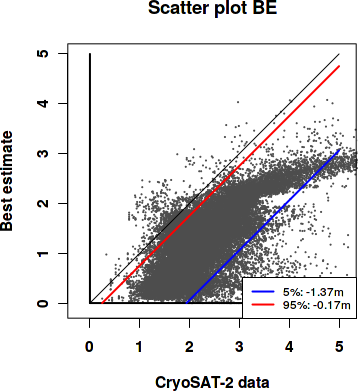
|
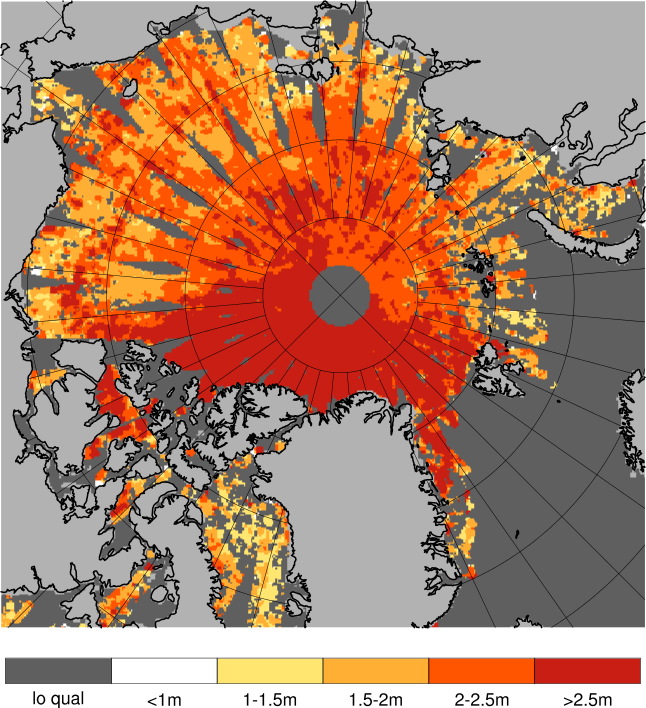
Observed sea ice thickness from CryoSAT
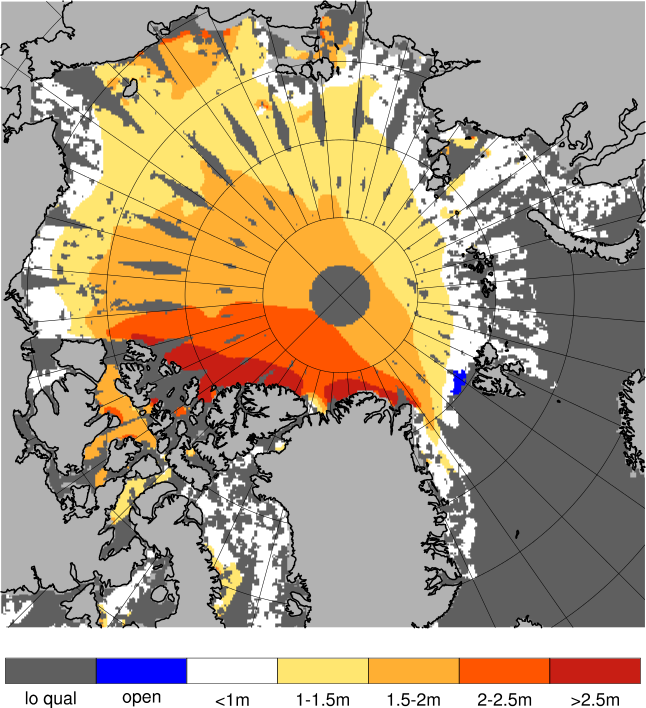
Sea ice thickness, best estimate product
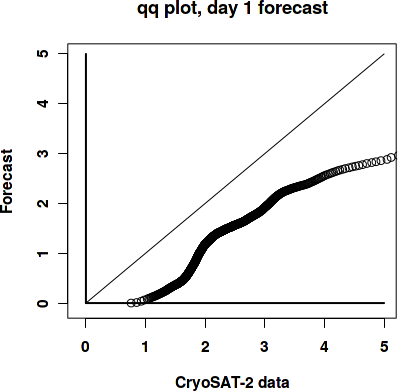
Day 1 forecast vs. observations
Contingency table
| observations | |||||||||
|---|---|---|---|---|---|---|---|---|---|
| open | c1 | c2 | c3 | c4 | c5 | c6 | |||
| m o d e l |
open | 0 | 0 | 0 | 0 | 0 | 0.001 | 0.001 | |
| c1 | 0 | 0.004 | 0.057 | 0.133 | 0.06 | 0.016 | 0.01 | ||
| c2 | 0 | 0 | 0.007 | 0.097 | 0.172 | 0.049 | 0.011 | ||
| c3 | 0 | 0 | 0.003 | 0.044 | 0.111 | 0.073 | 0.03 | ||
| c4 | 0 | 0 | 0.001 | 0.002 | 0.005 | 0.022 | 0.059 | ||
| c5 | 0 | 0 | 0 | 0 | 0 | 0.001 | 0.027 | ||
| c6 | 0 | 0 | 0 | 0 | 0 | 0 | 0.004 | ||
See category definitions for details.
Statistical distribution
|

|
Sea ice thickness, day 1 forecast

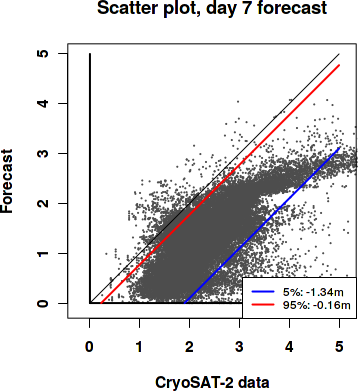
Day 7 forecast vs. observations
Contingency table
| observations | |||||||||
|---|---|---|---|---|---|---|---|---|---|
| open | c1 | c2 | c3 | c4 | c5 | c6 | |||
| m o d e l |
open | 0 | 0 | 0 | 0.001 | 0.001 | 0.001 | 0.001 | |
| c1 | 0 | 0.004 | 0.057 | 0.131 | 0.058 | 0.015 | 0.01 | ||
| c2 | 0 | 0 | 0.007 | 0.099 | 0.171 | 0.049 | 0.01 | ||
| c3 | 0 | 0 | 0.003 | 0.044 | 0.112 | 0.074 | 0.03 | ||
| c4 | 0 | 0 | 0.001 | 0.002 | 0.005 | 0.023 | 0.059 | ||
| c5 | 0 | 0 | 0 | 0 | 0 | 0.001 | 0.027 | ||
| c6 | 0 | 0 | 0 | 0 | 0 | 0 | 0.004 | ||
See category definitions for details.
Statistical distribution

|
|
Sea ice thickness, day 7 forecast

Generated by /metno/routine/sms/V2/SIthickness/c2iceWebPage.sh Fri Apr 26 01:09:01 UTC 2019 on arcmfcval