Validation of ice thickness - Full domain
Bulletin date: 2019-04-04
Model: ARC MFC - TOPAZ
Data source: UCL CryoSAT-2 sea ice thickness
Validation statistics summary
| Bias (m) | RMS (m) | total grids | low SIT | OK SIT | high SIT | |
|---|---|---|---|---|---|---|
| Best estimate | -1.01 | 1.15 | 48285 | 21473 | 26770 | 42 |
| Day 1 forecast | -0.99 | 1.14 | 48285 | 20930 | 27305 | 50 |
| Day 4 forecast | -0.99 | 1.14 | 48285 | 20820 | 27417 | 48 |
| Day 7 forecast | -0.98 | 1.13 | 48285 | 20676 | 27551 | 58 |
| Day 10 forecast | -0.98 | 1.12 | 48285 | 20247 | 27987 | 51 |
Numbers in the three rightmost columns are grid counts. Regions with high/low sea ice thickness correspond to areas with model offsets from the gridded observations outside of one standard deviation. (Standard deviations are provided in the observational product.)
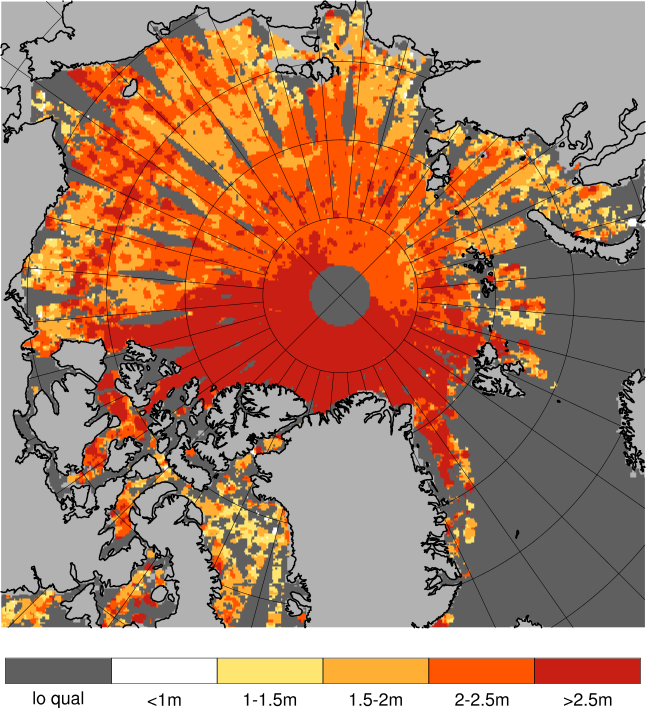
Definition of categories:
| Category | Sea ice thickness |
|---|---|
| c1 | <1m |
| c2 | 1 - 1.5m |
| c3 | 1.5 - 2m |
| c4 | 2 - 2.5m |
| c5 | 2.5 - 3m |
| c6 | >3m |
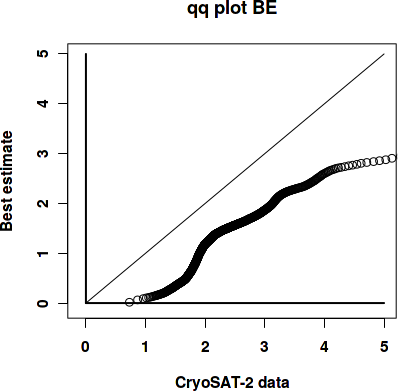
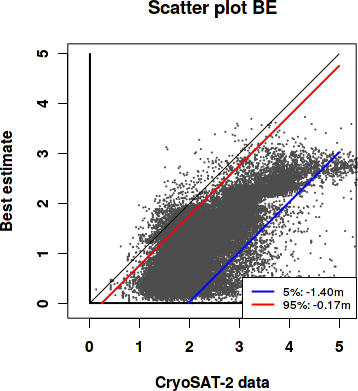
Best estimate vs. observations
Contingency table
| observations | |||||||||
|---|---|---|---|---|---|---|---|---|---|
| open | c1 | c2 | c3 | c4 | c5 | c6 | |||
| m o d e l |
open | 0 | 0 | 0 | 0 | 0 | 0 | 0 | |
| c1 | 0 | 0.004 | 0.048 | 0.12 | 0.063 | 0.02 | 0.012 | ||
| c2 | 0 | 0 | 0.008 | 0.11 | 0.194 | 0.045 | 0.011 | ||
| c3 | 0 | 0 | 0.003 | 0.042 | 0.112 | 0.056 | 0.033 | ||
| c4 | 0 | 0 | 0 | 0.001 | 0.003 | 0.018 | 0.06 | ||
| c5 | 0 | 0 | 0 | 0 | 0 | 0.001 | 0.03 | ||
| c6 | 0 | 0 | 0 | 0 | 0 | 0 | 0.003 | ||
See category definitions for details.
Statistical distribution
|
|
Observed sea ice thickness from CryoSAT
Sea ice thickness, best estimate product

Day 1 forecast vs. observations
Contingency table
| observations | |||||||||
|---|---|---|---|---|---|---|---|---|---|
| open | c1 | c2 | c3 | c4 | c5 | c6 | |||
| m o d e l |
open | 0 | 0 | 0 | 0 | 0 | 0 | 0 | |
| c1 | 0 | 0.004 | 0.048 | 0.118 | 0.062 | 0.02 | 0.011 | ||
| c2 | 0 | 0 | 0.009 | 0.11 | 0.191 | 0.046 | 0.011 | ||
| c3 | 0 | 0 | 0.003 | 0.043 | 0.116 | 0.056 | 0.032 | ||
| c4 | 0 | 0 | 0 | 0.001 | 0.002 | 0.018 | 0.061 | ||
| c5 | 0 | 0 | 0 | 0 | 0.001 | 0.002 | 0.029 | ||
| c6 | 0 | 0 | 0 | 0 | 0 | 0 | 0.004 | ||
See category definitions for details.
Statistical distribution

|

|
Sea ice thickness, day 1 forecast

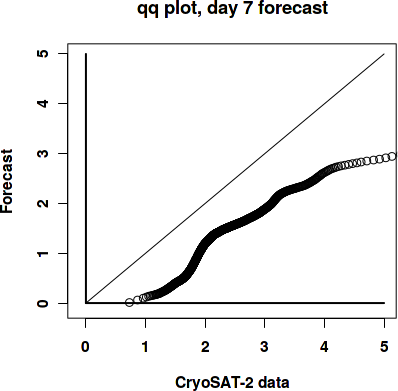
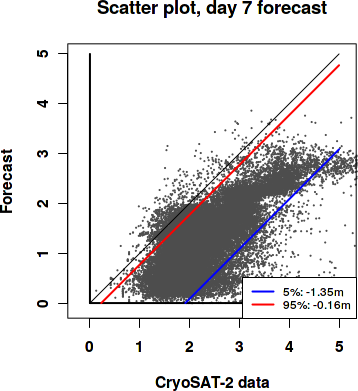
Day 7 forecast vs. observations
Contingency table
| observations | |||||||||
|---|---|---|---|---|---|---|---|---|---|
| open | c1 | c2 | c3 | c4 | c5 | c6 | |||
| m o d e l |
open | 0 | 0 | 0 | 0 | 0 | 0 | 0 | |
| c1 | 0 | 0.004 | 0.048 | 0.117 | 0.064 | 0.019 | 0.01 | ||
| c2 | 0 | 0 | 0.009 | 0.109 | 0.187 | 0.045 | 0.011 | ||
| c3 | 0 | 0 | 0.003 | 0.046 | 0.119 | 0.057 | 0.032 | ||
| c4 | 0 | 0 | 0 | 0.001 | 0.003 | 0.019 | 0.061 | ||
| c5 | 0 | 0 | 0 | 0 | 0.001 | 0.002 | 0.03 | ||
| c6 | 0 | 0 | 0 | 0 | 0 | 0 | 0.004 | ||
See category definitions for details.
Statistical distribution
|
|
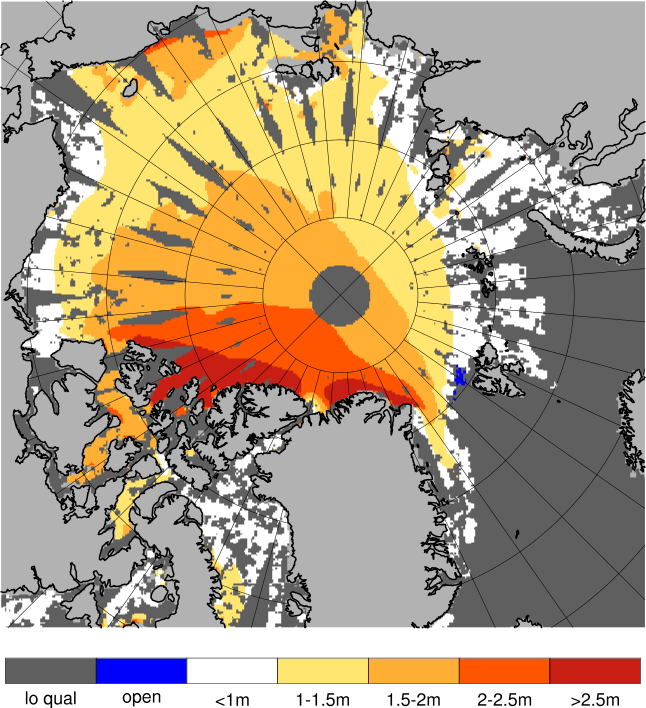
Sea ice thickness, day 7 forecast
Generated by /metno/routine/sms/V2/SIthickness/c2iceWebPage.sh Fri Apr 19 01:11:21 UTC 2019 on arcmfcval