Validation of ice thickness - Full domain
Bulletin date: 2019-03-21
Model: ARC MFC - TOPAZ
Data source: UCL CryoSAT-2 sea ice thickness
Validation statistics summary
| Bias (m) | RMS (m) | total grids | low SIT | OK SIT | high SIT | |
|---|---|---|---|---|---|---|
| Best estimate | -0.94 | 1.1 | 49538 | 21366 | 28094 | 78 |
| Day 1 forecast | -0.93 | 1.09 | 49538 | 21118 | 28344 | 76 |
| Day 4 forecast | -0.94 | 1.09 | 49538 | 21251 | 28212 | 75 |
| Day 7 forecast | -0.92 | 1.08 | 49538 | 20568 | 28879 | 91 |
| Day 10 forecast | -0.93 | 1.08 | 49538 | 20962 | 28502 | 74 |
Numbers in the three rightmost columns are grid counts. Regions with high/low sea ice thickness correspond to areas with model offsets from the gridded observations outside of one standard deviation. (Standard deviations are provided in the observational product.)
Definition of categories:
| Category | Sea ice thickness |
|---|---|
| c1 | <1m |
| c2 | 1 - 1.5m |
| c3 | 1.5 - 2m |
| c4 | 2 - 2.5m |
| c5 | 2.5 - 3m |
| c6 | >3m |
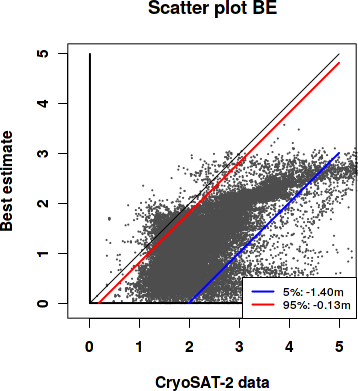
Best estimate vs. observations
Contingency table
| observations | |||||||||
|---|---|---|---|---|---|---|---|---|---|
| open | c1 | c2 | c3 | c4 | c5 | c6 | |||
| m o d e l |
open | 0 | 0 | 0 | 0.001 | 0 | 0.001 | 0.001 | |
| c1 | 0 | 0.003 | 0.055 | 0.144 | 0.057 | 0.02 | 0.01 | ||
| c2 | 0 | 0 | 0.017 | 0.215 | 0.161 | 0.03 | 0.006 | ||
| c3 | 0 | 0 | 0.005 | 0.039 | 0.055 | 0.059 | 0.021 | ||
| c4 | 0 | 0 | 0 | 0 | 0.002 | 0.019 | 0.055 | ||
| c5 | 0 | 0 | 0 | 0 | 0.001 | 0.002 | 0.019 | ||
| c6 | 0 | 0 | 0 | 0 | 0 | 0 | 0.001 | ||
See category definitions for details.
Statistical distribution

|
|
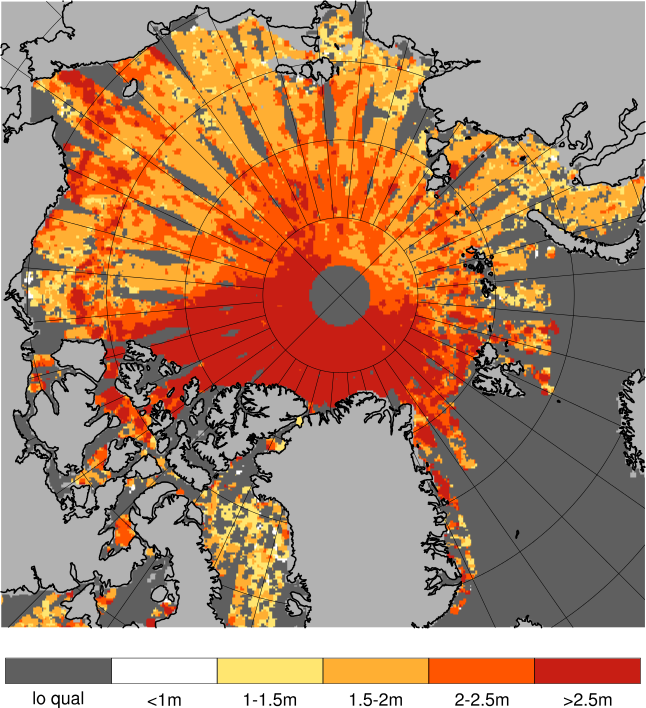
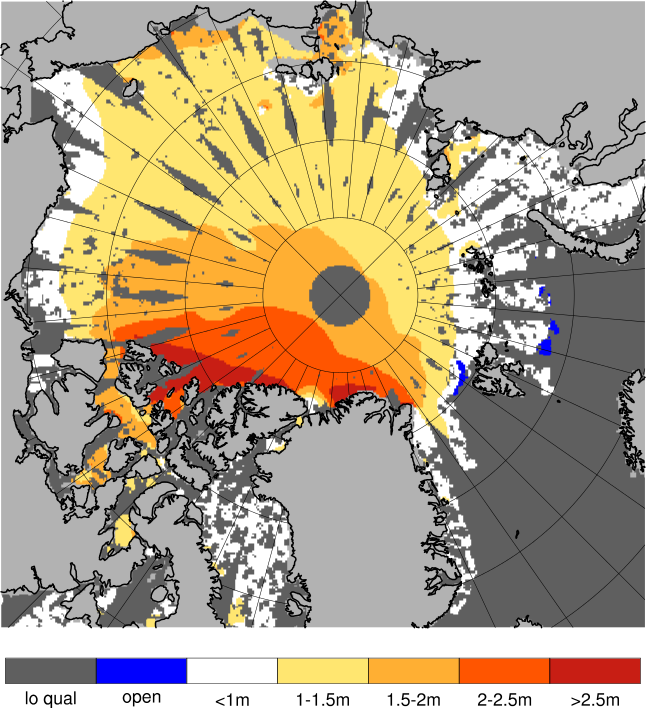
Observed sea ice thickness from CryoSAT
Sea ice thickness, best estimate product

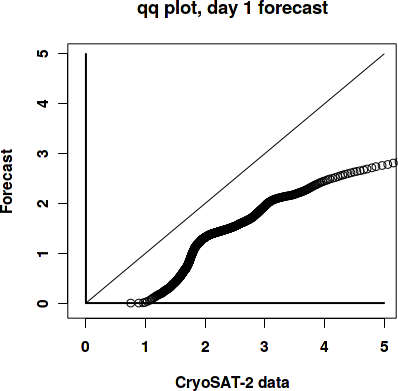
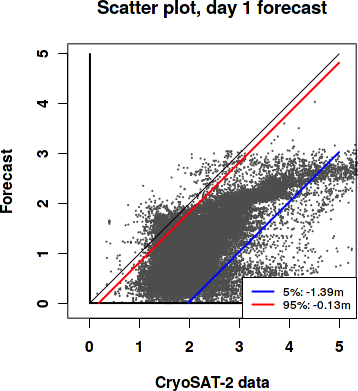
Day 1 forecast vs. observations
Contingency table
| observations | |||||||||
|---|---|---|---|---|---|---|---|---|---|
| open | c1 | c2 | c3 | c4 | c5 | c6 | |||
| m o d e l |
open | 0 | 0 | 0 | 0.001 | 0 | 0.001 | 0.001 | |
| c1 | 0 | 0.003 | 0.055 | 0.142 | 0.056 | 0.019 | 0.01 | ||
| c2 | 0 | 0 | 0.016 | 0.215 | 0.163 | 0.032 | 0.007 | ||
| c3 | 0 | 0 | 0.005 | 0.039 | 0.053 | 0.058 | 0.019 | ||
| c4 | 0 | 0 | 0 | 0 | 0.002 | 0.02 | 0.056 | ||
| c5 | 0 | 0 | 0 | 0 | 0.001 | 0.001 | 0.019 | ||
| c6 | 0 | 0 | 0 | 0 | 0 | 0 | 0.001 | ||
See category definitions for details.
Statistical distribution
|
|
Sea ice thickness, day 1 forecast
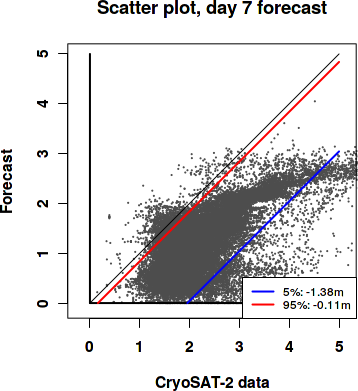
Day 7 forecast vs. observations
Contingency table
| observations | |||||||||
|---|---|---|---|---|---|---|---|---|---|
| open | c1 | c2 | c3 | c4 | c5 | c6 | |||
| m o d e l |
open | 0 | 0 | 0 | 0.001 | 0.001 | 0.001 | 0.001 | |
| c1 | 0 | 0.003 | 0.055 | 0.141 | 0.055 | 0.019 | 0.009 | ||
| c2 | 0 | 0 | 0.017 | 0.212 | 0.156 | 0.03 | 0.007 | ||
| c3 | 0 | 0 | 0.006 | 0.043 | 0.061 | 0.059 | 0.019 | ||
| c4 | 0 | 0 | 0 | 0 | 0.003 | 0.021 | 0.057 | ||
| c5 | 0 | 0 | 0 | 0 | 0.001 | 0.001 | 0.019 | ||
| c6 | 0 | 0 | 0 | 0 | 0 | 0 | 0.001 | ||
See category definitions for details.
Statistical distribution

|
|
Sea ice thickness, day 7 forecast

Generated by /metno/routine/sms/V2/SIthickness/c2iceWebPage.sh Fri Apr 5 01:12:38 UTC 2019 on arcmfcval