Validation of ice thickness - Full domain
Bulletin date: 2019-03-14
Model: ARC MFC - TOPAZ
Data source: UCL CryoSAT-2 sea ice thickness
Validation statistics summary
| Bias (m) | RMS (m) | total grids | low SIT | OK SIT | high SIT | |
|---|---|---|---|---|---|---|
| Best estimate | -0.95 | 1.1 | 49105 | 21955 | 27081 | 69 |
| Day 1 forecast | -0.94 | 1.09 | 49105 | 21633 | 27398 | 74 |
| Day 4 forecast | -0.94 | 1.09 | 49105 | 21800 | 27230 | 75 |
| Day 7 forecast | -0.93 | 1.08 | 49105 | 21033 | 27995 | 77 |
| Day 10 forecast | -0.94 | 1.08 | 49105 | 21566 | 27454 | 85 |
Numbers in the three rightmost columns are grid counts. Regions with high/low sea ice thickness correspond to areas with model offsets from the gridded observations outside of one standard deviation. (Standard deviations are provided in the observational product.)
Definition of categories:
| Category | Sea ice thickness |
|---|---|
| c1 | <1m |
| c2 | 1 - 1.5m |
| c3 | 1.5 - 2m |
| c4 | 2 - 2.5m |
| c5 | 2.5 - 3m |
| c6 | >3m |
Best estimate vs. observations
Contingency table
| observations | |||||||||
|---|---|---|---|---|---|---|---|---|---|
| open | c1 | c2 | c3 | c4 | c5 | c6 | |||
| m o d e l |
open | 0 | 0 | 0 | 0.001 | 0 | 0.001 | 0 | |
| c1 | 0 | 0.004 | 0.06 | 0.145 | 0.056 | 0.018 | 0.009 | ||
| c2 | 0 | 0.001 | 0.021 | 0.22 | 0.172 | 0.034 | 0.005 | ||
| c3 | 0 | 0 | 0.005 | 0.031 | 0.035 | 0.061 | 0.027 | ||
| c4 | 0 | 0 | 0 | 0.001 | 0.002 | 0.012 | 0.059 | ||
| c5 | 0 | 0 | 0 | 0 | 0.001 | 0.001 | 0.016 | ||
| c6 | 0 | 0 | 0 | 0 | 0 | 0 | 0.001 | ||
See category definitions for details.
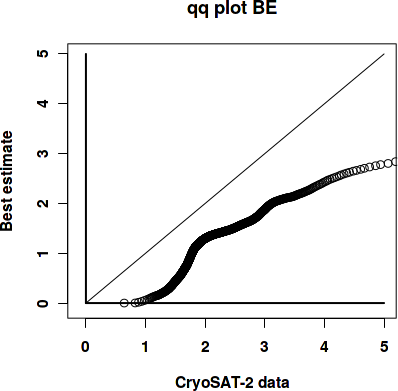
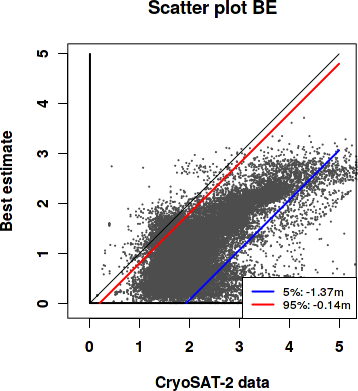
Statistical distribution
|
|
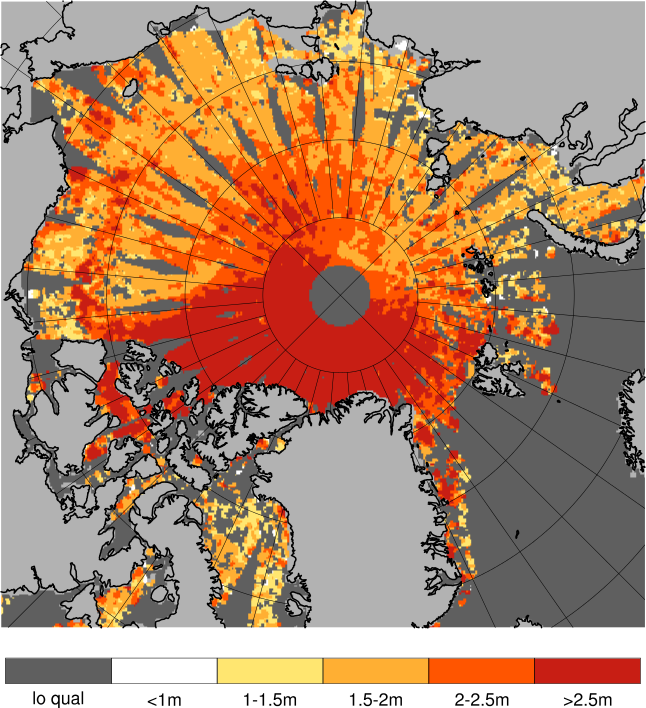
Observed sea ice thickness from CryoSAT
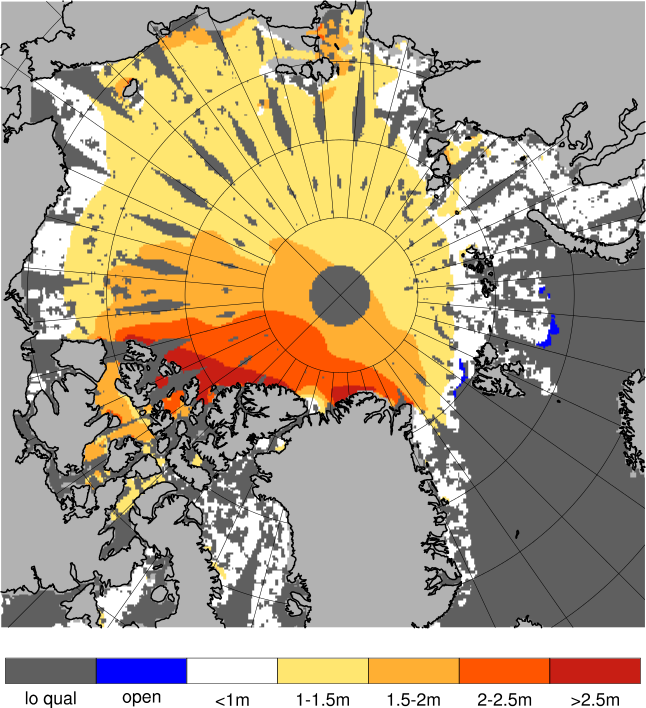
Sea ice thickness, best estimate product
Day 1 forecast vs. observations
Contingency table
| observations | |||||||||
|---|---|---|---|---|---|---|---|---|---|
| open | c1 | c2 | c3 | c4 | c5 | c6 | |||
| m o d e l |
open | 0 | 0 | 0 | 0.001 | 0.001 | 0.001 | 0.001 | |
| c1 | 0 | 0.004 | 0.06 | 0.144 | 0.054 | 0.018 | 0.008 | ||
| c2 | 0 | 0.001 | 0.021 | 0.221 | 0.174 | 0.035 | 0.005 | ||
| c3 | 0 | 0 | 0.005 | 0.031 | 0.035 | 0.06 | 0.026 | ||
| c4 | 0 | 0 | 0 | 0.001 | 0.002 | 0.013 | 0.06 | ||
| c5 | 0 | 0 | 0 | 0 | 0.001 | 0.001 | 0.017 | ||
| c6 | 0 | 0 | 0 | 0 | 0 | 0 | 0.001 | ||
See category definitions for details.
Statistical distribution

|

|
Sea ice thickness, day 1 forecast

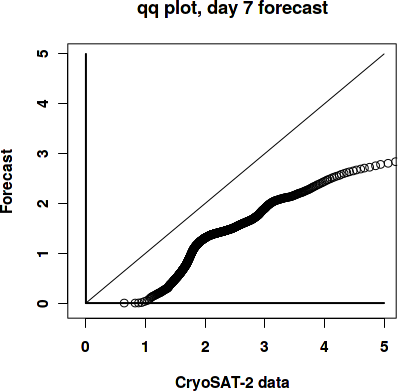
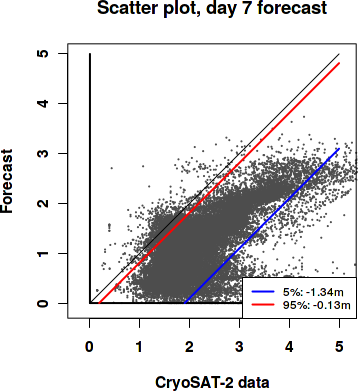
Day 7 forecast vs. observations
Contingency table
| observations | |||||||||
|---|---|---|---|---|---|---|---|---|---|
| open | c1 | c2 | c3 | c4 | c5 | c6 | |||
| m o d e l |
open | 0 | 0 | 0 | 0.001 | 0.001 | 0.001 | 0.001 | |
| c1 | 0 | 0.004 | 0.059 | 0.142 | 0.053 | 0.018 | 0.008 | ||
| c2 | 0 | 0.001 | 0.022 | 0.221 | 0.172 | 0.034 | 0.005 | ||
| c3 | 0 | 0 | 0.005 | 0.032 | 0.038 | 0.06 | 0.026 | ||
| c4 | 0 | 0 | 0 | 0.001 | 0.002 | 0.014 | 0.06 | ||
| c5 | 0 | 0 | 0 | 0 | 0.001 | 0.001 | 0.017 | ||
| c6 | 0 | 0 | 0 | 0 | 0 | 0 | 0.001 | ||
See category definitions for details.
Statistical distribution
|
|
Sea ice thickness, day 7 forecast

Generated by /metno/routine/sms/V2/SIthickness/c2iceWebPage.sh Fri Mar 29 01:12:23 UTC 2019 on arcmfcval