Validation of ice thickness - Full domain
Bulletin date: 2019-02-28
Model: ARC MFC - TOPAZ
Data source: UCL CryoSAT-2 sea ice thickness
Validation statistics summary
| Bias (m) | RMS (m) | total grids | low SIT | OK SIT | high SIT | |
|---|---|---|---|---|---|---|
| Best estimate | -0.84 | 0.99 | 47208 | 17152 | 29999 | 57 |
| Day 1 forecast | -0.83 | 0.99 | 47208 | 16996 | 30152 | 60 |
| Day 4 forecast | -0.84 | 0.99 | 47208 | 17113 | 30035 | 60 |
| Day 7 forecast | -0.82 | 0.97 | 47208 | 16444 | 30699 | 65 |
| Day 10 forecast | -0.84 | 0.99 | 47208 | 17030 | 30117 | 61 |
Numbers in the three rightmost columns are grid counts. Regions with high/low sea ice thickness correspond to areas with model offsets from the gridded observations outside of one standard deviation. (Standard deviations are provided in the observational product.)
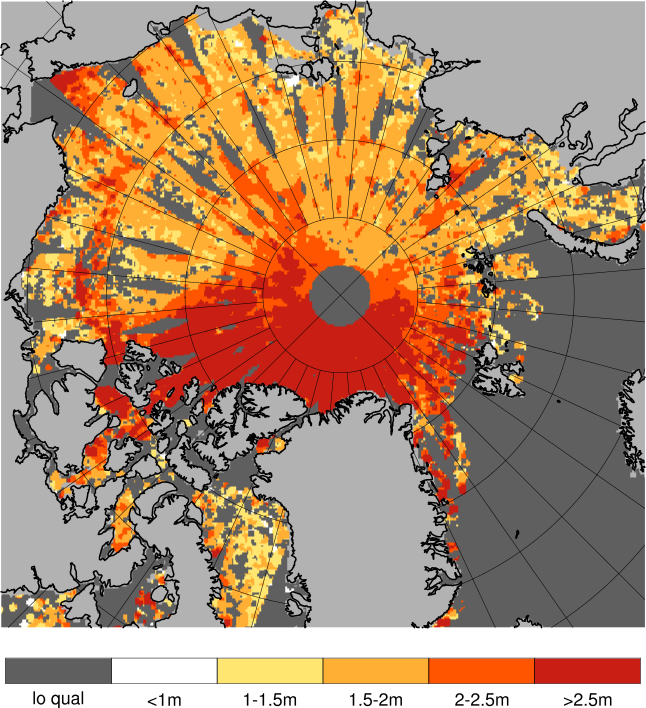
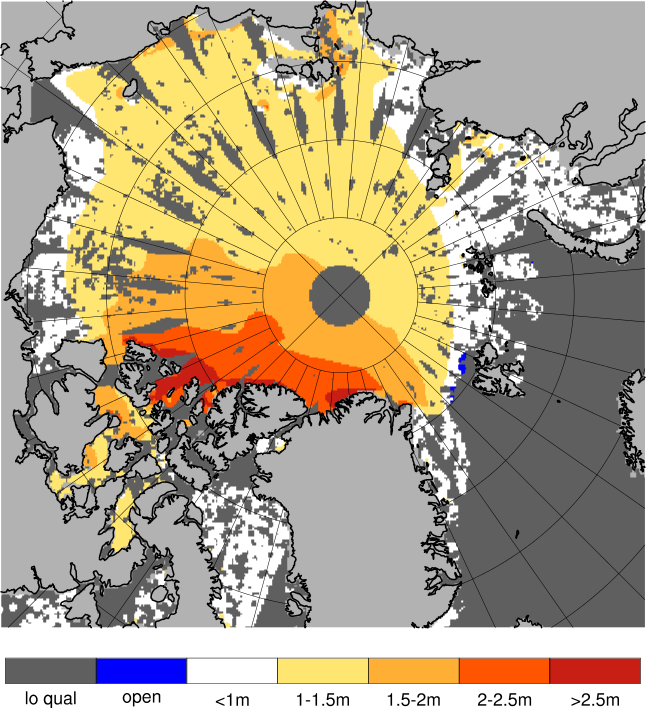
Definition of categories:
| Category | Sea ice thickness |
|---|---|
| c1 | <1m |
| c2 | 1 - 1.5m |
| c3 | 1.5 - 2m |
| c4 | 2 - 2.5m |
| c5 | 2.5 - 3m |
| c6 | >3m |
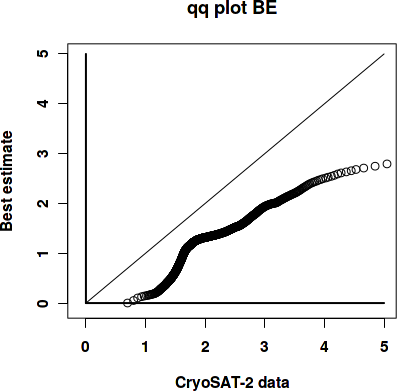
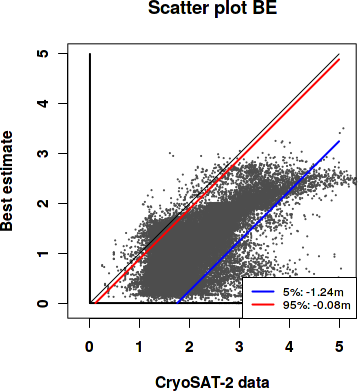
Best estimate vs. observations
Contingency table
| observations | |||||||||
|---|---|---|---|---|---|---|---|---|---|
| open | c1 | c2 | c3 | c4 | c5 | c6 | |||
| m o d e l |
open | 0 | 0 | 0 | 0 | 0 | 0.001 | 0.001 | |
| c1 | 0 | 0.005 | 0.088 | 0.127 | 0.041 | 0.015 | 0.009 | ||
| c2 | 0 | 0.001 | 0.051 | 0.284 | 0.118 | 0.03 | 0.003 | ||
| c3 | 0 | 0 | 0.008 | 0.026 | 0.03 | 0.069 | 0.02 | ||
| c4 | 0 | 0 | 0 | 0 | 0.003 | 0.008 | 0.05 | ||
| c5 | 0 | 0 | 0 | 0 | 0.001 | 0.002 | 0.011 | ||
| c6 | 0 | 0 | 0 | 0 | 0 | 0 | 0 | ||
See category definitions for details.
Statistical distribution
|
|
Observed sea ice thickness from CryoSAT
Sea ice thickness, best estimate product

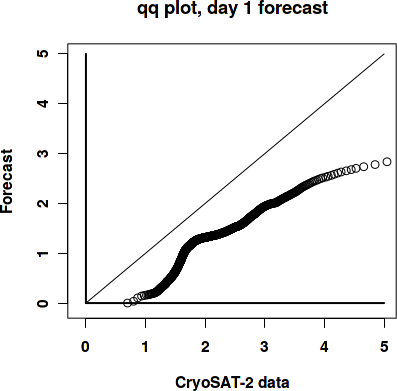
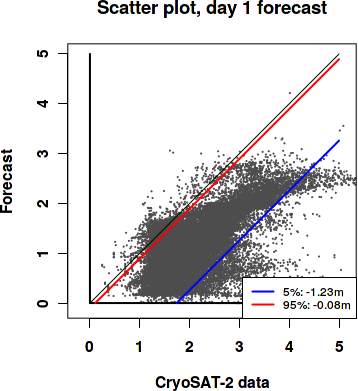
Day 1 forecast vs. observations
Contingency table
| observations | |||||||||
|---|---|---|---|---|---|---|---|---|---|
| open | c1 | c2 | c3 | c4 | c5 | c6 | |||
| m o d e l |
open | 0 | 0 | 0 | 0 | 0 | 0.001 | 0.001 | |
| c1 | 0 | 0.005 | 0.088 | 0.126 | 0.04 | 0.014 | 0.009 | ||
| c2 | 0 | 0.001 | 0.051 | 0.284 | 0.117 | 0.03 | 0.003 | ||
| c3 | 0 | 0 | 0.008 | 0.026 | 0.03 | 0.069 | 0.019 | ||
| c4 | 0 | 0 | 0 | 0 | 0.003 | 0.008 | 0.049 | ||
| c5 | 0 | 0 | 0 | 0 | 0.001 | 0.002 | 0.012 | ||
| c6 | 0 | 0 | 0 | 0 | 0 | 0 | 0 | ||
See category definitions for details.
Statistical distribution
|
|
Sea ice thickness, day 1 forecast

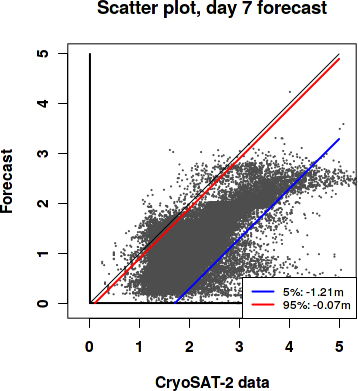
Day 7 forecast vs. observations
Contingency table
| observations | |||||||||
|---|---|---|---|---|---|---|---|---|---|
| open | c1 | c2 | c3 | c4 | c5 | c6 | |||
| m o d e l |
open | 0 | 0 | 0 | 0 | 0 | 0.001 | 0.001 | |
| c1 | 0 | 0.005 | 0.088 | 0.124 | 0.038 | 0.013 | 0.009 | ||
| c2 | 0 | 0.001 | 0.051 | 0.284 | 0.118 | 0.03 | 0.003 | ||
| c3 | 0 | 0 | 0.009 | 0.028 | 0.032 | 0.068 | 0.018 | ||
| c4 | 0 | 0 | 0 | 0.001 | 0.003 | 0.011 | 0.05 | ||
| c5 | 0 | 0 | 0 | 0 | 0.001 | 0.002 | 0.012 | ||
| c6 | 0 | 0 | 0 | 0 | 0 | 0 | 0 | ||
See category definitions for details.
Statistical distribution

|
|
Sea ice thickness, day 7 forecast
Generated by /metno/routine/sms/V2/SIthickness/c2iceWebPage.sh Fri Mar 15 01:12:55 UTC 2019 on arcmfcval