Validation of ice thickness - Full domain
Bulletin date: 2019-02-14
Model: ARC MFC - TOPAZ
Data source: UCL CryoSAT-2 sea ice thickness
Validation statistics summary
| Bias (m) | RMS (m) | total grids | low SIT | OK SIT | high SIT | |
|---|---|---|---|---|---|---|
| Best estimate | -0.88 | 1.03 | 44708 | 18383 | 26287 | 38 |
| Day 1 forecast | -0.87 | 1.03 | 44708 | 18156 | 26512 | 40 |
| Day 4 forecast | -0.88 | 1.03 | 44708 | 18310 | 26351 | 47 |
| Day 7 forecast | -0.86 | 1.01 | 44708 | 17665 | 26988 | 55 |
| Day 10 forecast | -0.88 | 1.03 | 44708 | 18386 | 26260 | 62 |
Numbers in the three rightmost columns are grid counts. Regions with high/low sea ice thickness correspond to areas with model offsets from the gridded observations outside of one standard deviation. (Standard deviations are provided in the observational product.)
Definition of categories:
| Category | Sea ice thickness |
|---|---|
| c1 | <1m |
| c2 | 1 - 1.5m |
| c3 | 1.5 - 2m |
| c4 | 2 - 2.5m |
| c5 | 2.5 - 3m |
| c6 | >3m |
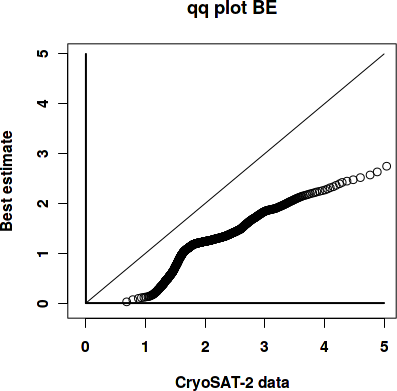
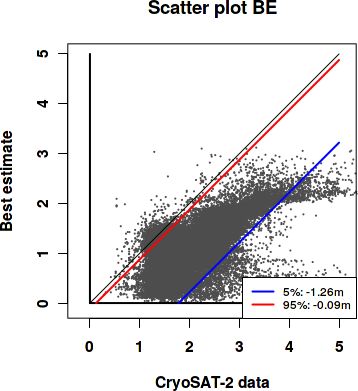
Best estimate vs. observations
Contingency table
| observations | |||||||||
|---|---|---|---|---|---|---|---|---|---|
| open | c1 | c2 | c3 | c4 | c5 | c6 | |||
| m o d e l |
open | 0 | 0 | 0 | 0 | 0 | 0 | 0 | |
| c1 | 0 | 0.005 | 0.095 | 0.145 | 0.045 | 0.016 | 0.007 | ||
| c2 | 0 | 0.001 | 0.091 | 0.256 | 0.103 | 0.041 | 0.005 | ||
| c3 | 0 | 0 | 0.004 | 0.007 | 0.023 | 0.065 | 0.04 | ||
| c4 | 0 | 0 | 0 | 0 | 0.002 | 0.003 | 0.04 | ||
| c5 | 0 | 0 | 0 | 0 | 0 | 0.001 | 0.004 | ||
| c6 | 0 | 0 | 0 | 0 | 0 | 0 | 0 | ||
See category definitions for details.
Statistical distribution
|
|
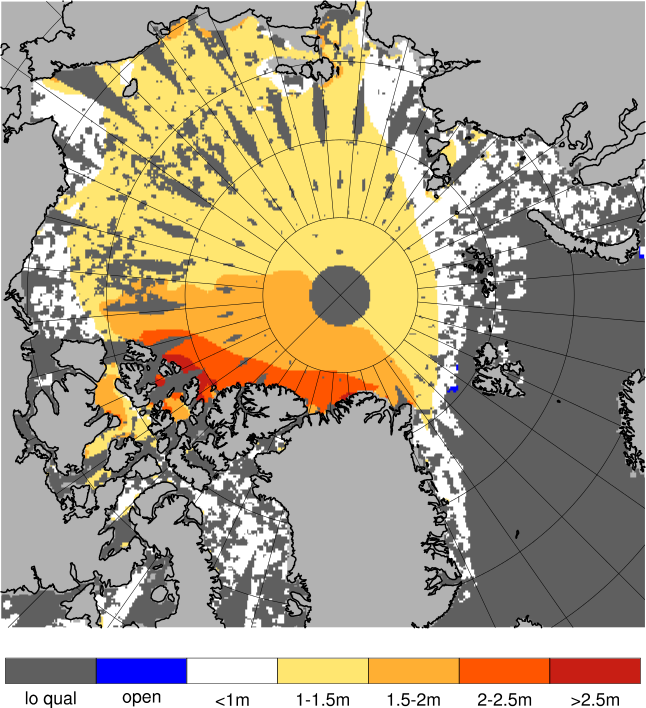
Observed sea ice thickness from CryoSAT
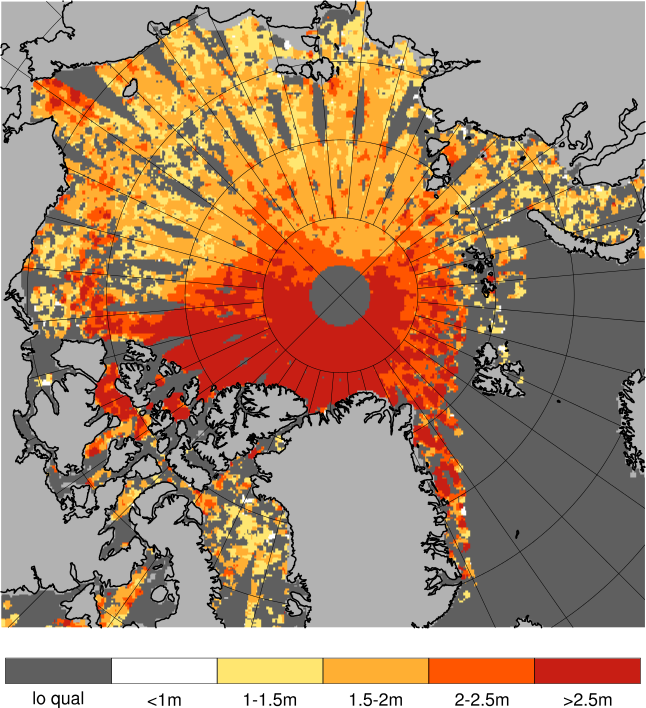
Sea ice thickness, best estimate product

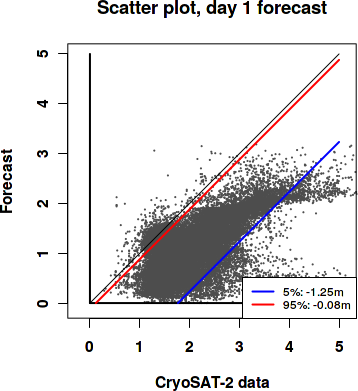
Day 1 forecast vs. observations
Contingency table
| observations | |||||||||
|---|---|---|---|---|---|---|---|---|---|
| open | c1 | c2 | c3 | c4 | c5 | c6 | |||
| m o d e l |
open | 0 | 0 | 0 | 0 | 0 | 0 | 0 | |
| c1 | 0 | 0.005 | 0.096 | 0.145 | 0.044 | 0.016 | 0.007 | ||
| c2 | 0 | 0.001 | 0.091 | 0.256 | 0.103 | 0.041 | 0.005 | ||
| c3 | 0 | 0 | 0.004 | 0.007 | 0.024 | 0.065 | 0.041 | ||
| c4 | 0 | 0 | 0 | 0 | 0.002 | 0.003 | 0.038 | ||
| c5 | 0 | 0 | 0 | 0 | 0 | 0.001 | 0.005 | ||
| c6 | 0 | 0 | 0 | 0 | 0 | 0 | 0 | ||
See category definitions for details.
Statistical distribution

|
|
Sea ice thickness, day 1 forecast
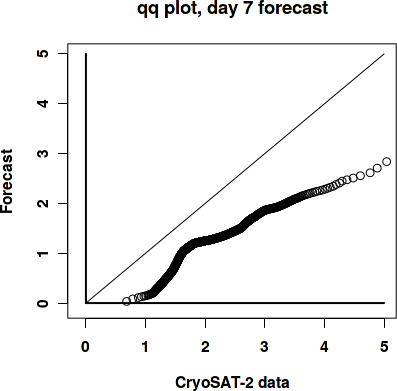
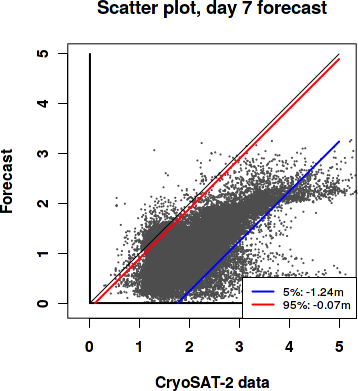
Day 7 forecast vs. observations
Contingency table
| observations | |||||||||
|---|---|---|---|---|---|---|---|---|---|
| open | c1 | c2 | c3 | c4 | c5 | c6 | |||
| m o d e l |
open | 0 | 0 | 0 | 0 | 0 | 0 | 0 | |
| c1 | 0 | 0.005 | 0.093 | 0.138 | 0.042 | 0.016 | 0.007 | ||
| c2 | 0 | 0.001 | 0.092 | 0.261 | 0.103 | 0.04 | 0.005 | ||
| c3 | 0 | 0 | 0.005 | 0.008 | 0.025 | 0.066 | 0.039 | ||
| c4 | 0 | 0 | 0 | 0 | 0.002 | 0.003 | 0.039 | ||
| c5 | 0 | 0 | 0 | 0 | 0 | 0.001 | 0.005 | ||
| c6 | 0 | 0 | 0 | 0 | 0 | 0 | 0 | ||
See category definitions for details.
Statistical distribution
|
|
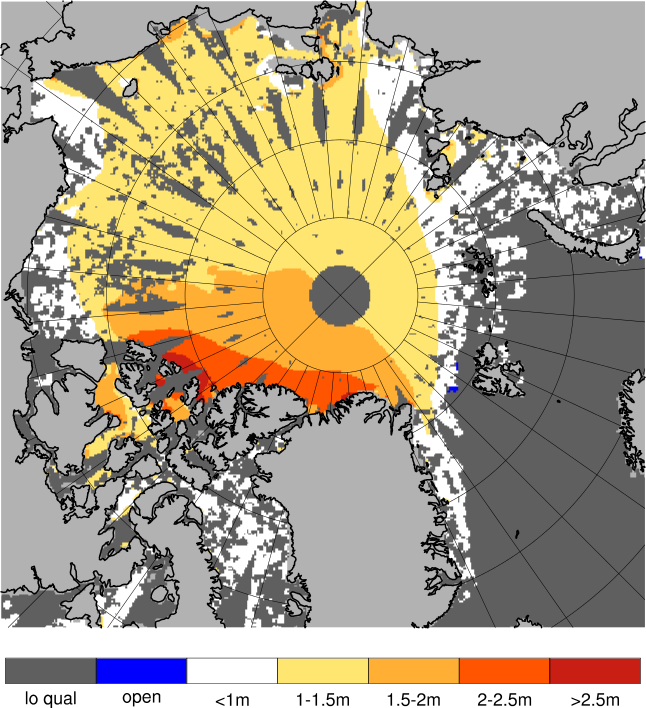
Sea ice thickness, day 7 forecast
Generated by /metno/routine/sms/V2/SIthickness/c2iceWebPage.sh Fri Mar 1 01:13:26 UTC 2019 on arcmfcval