Validation of ice thickness - Full domain
Bulletin date: 2019-02-07
Model: ARC MFC - TOPAZ
Data source: UCL CryoSAT-2 sea ice thickness
Validation statistics summary
| Bias (m) | RMS (m) | total grids | low SIT | OK SIT | high SIT | |
|---|---|---|---|---|---|---|
| Best estimate | -0.86 | 1.03 | 43401 | 17413 | 25942 | 46 |
| Day 1 forecast | -0.85 | 1.03 | 43401 | 17233 | 26118 | 50 |
| Day 4 forecast | -0.86 | 1.03 | 43401 | 17428 | 25920 | 53 |
| Day 7 forecast | -0.84 | 1.01 | 43401 | 16716 | 26624 | 61 |
| Day 10 forecast | -0.86 | 1.03 | 43401 | 17488 | 25872 | 41 |
Numbers in the three rightmost columns are grid counts. Regions with high/low sea ice thickness correspond to areas with model offsets from the gridded observations outside of one standard deviation. (Standard deviations are provided in the observational product.)
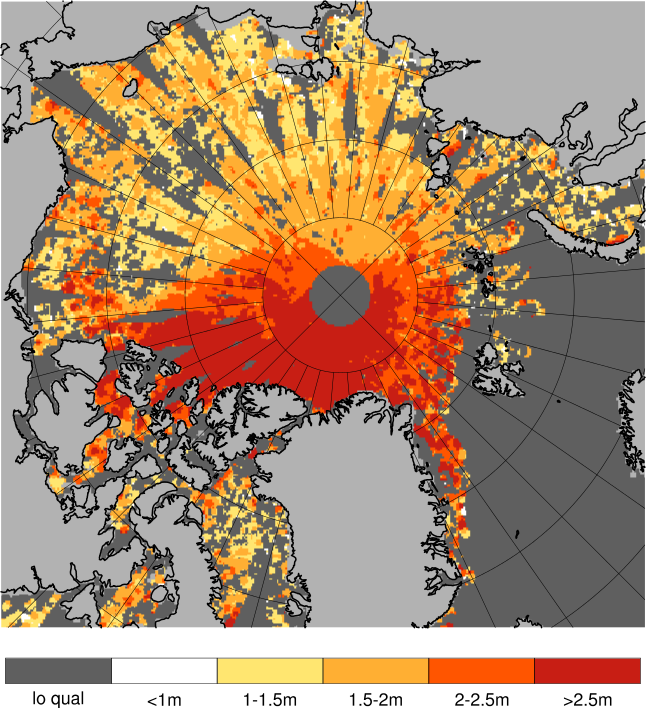
Definition of categories:
| Category | Sea ice thickness |
|---|---|
| c1 | <1m |
| c2 | 1 - 1.5m |
| c3 | 1.5 - 2m |
| c4 | 2 - 2.5m |
| c5 | 2.5 - 3m |
| c6 | >3m |
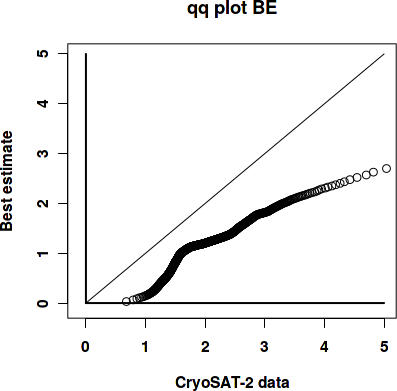
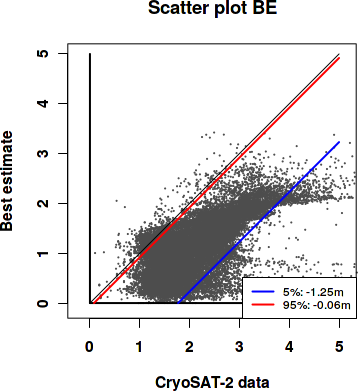
Best estimate vs. observations
Contingency table
| observations | |||||||||
|---|---|---|---|---|---|---|---|---|---|
| open | c1 | c2 | c3 | c4 | c5 | c6 | |||
| m o d e l |
open | 0 | 0 | 0 | 0 | 0 | 0 | 0 | |
| c1 | 0 | 0.006 | 0.114 | 0.155 | 0.045 | 0.016 | 0.007 | ||
| c2 | 0 | 0.003 | 0.128 | 0.212 | 0.087 | 0.038 | 0.002 | ||
| c3 | 0 | 0 | 0.002 | 0.009 | 0.034 | 0.057 | 0.039 | ||
| c4 | 0 | 0 | 0 | 0 | 0.002 | 0.005 | 0.034 | ||
| c5 | 0 | 0 | 0 | 0 | 0 | 0.001 | 0.004 | ||
| c6 | 0 | 0 | 0 | 0 | 0 | 0 | 0 | ||
See category definitions for details.
Statistical distribution
|
|
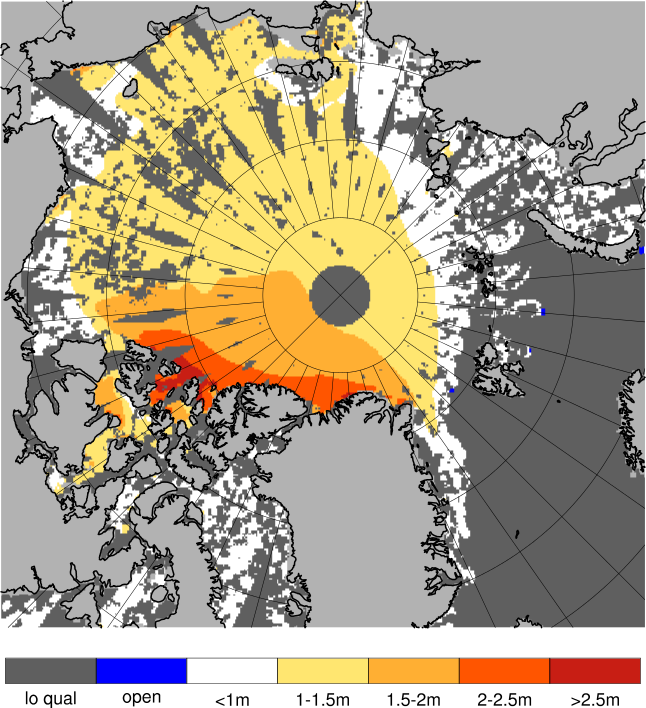
Observed sea ice thickness from CryoSAT
Sea ice thickness, best estimate product

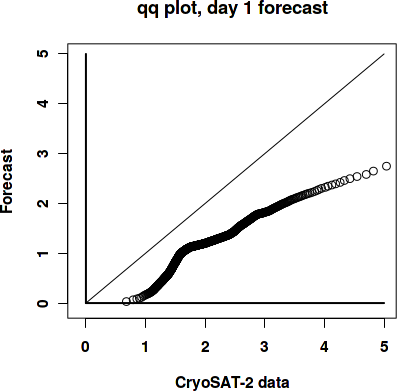
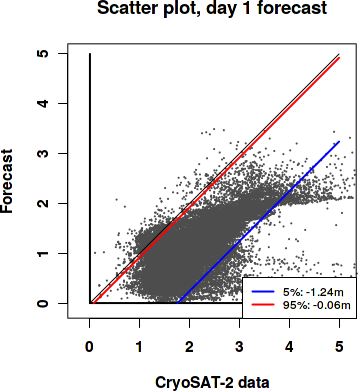
Day 1 forecast vs. observations
Contingency table
| observations | |||||||||
|---|---|---|---|---|---|---|---|---|---|
| open | c1 | c2 | c3 | c4 | c5 | c6 | |||
| m o d e l |
open | 0 | 0 | 0 | 0 | 0 | 0 | 0 | |
| c1 | 0 | 0.006 | 0.114 | 0.156 | 0.045 | 0.016 | 0.007 | ||
| c2 | 0 | 0.003 | 0.127 | 0.211 | 0.086 | 0.038 | 0.002 | ||
| c3 | 0 | 0 | 0.003 | 0.009 | 0.035 | 0.057 | 0.039 | ||
| c4 | 0 | 0 | 0 | 0 | 0.002 | 0.005 | 0.032 | ||
| c5 | 0 | 0 | 0 | 0 | 0 | 0.001 | 0.005 | ||
| c6 | 0 | 0 | 0 | 0 | 0 | 0 | 0 | ||
See category definitions for details.
Statistical distribution
|
|
Sea ice thickness, day 1 forecast
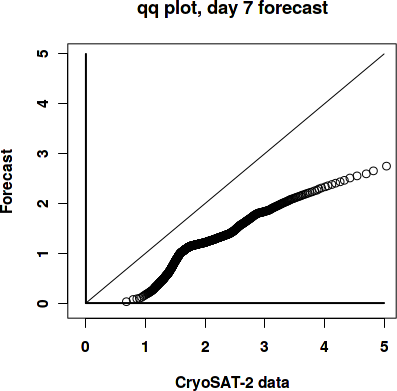
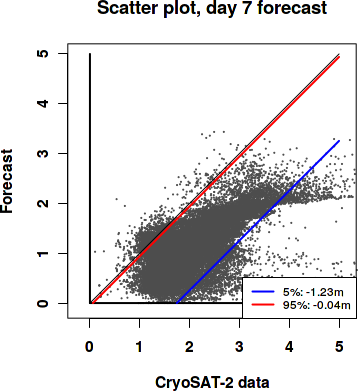
Day 7 forecast vs. observations
Contingency table
| observations | |||||||||
|---|---|---|---|---|---|---|---|---|---|
| open | c1 | c2 | c3 | c4 | c5 | c6 | |||
| m o d e l |
open | 0 | 0 | 0 | 0 | 0 | 0 | 0 | |
| c1 | 0 | 0.006 | 0.111 | 0.151 | 0.043 | 0.016 | 0.007 | ||
| c2 | 0 | 0.003 | 0.129 | 0.215 | 0.086 | 0.037 | 0.002 | ||
| c3 | 0 | 0 | 0.004 | 0.01 | 0.036 | 0.058 | 0.037 | ||
| c4 | 0 | 0 | 0 | 0 | 0.002 | 0.005 | 0.034 | ||
| c5 | 0 | 0 | 0 | 0 | 0.001 | 0.001 | 0.005 | ||
| c6 | 0 | 0 | 0 | 0 | 0 | 0 | 0 | ||
See category definitions for details.
Statistical distribution
|
|
Sea ice thickness, day 7 forecast

Generated by /metno/routine/sms/V2/SIthickness/c2iceWebPage.sh Fri Feb 22 01:13:32 UTC 2019 on arcmfcval