Validation of ice thickness - Full domain
Bulletin date: 2019-01-03
Model: ARC MFC - TOPAZ
Data source: UCL CryoSAT-2 sea ice thickness
Validation statistics summary
| Bias (m) | RMS (m) | total grids | low SIT | OK SIT | high SIT | |
|---|---|---|---|---|---|---|
| Best estimate | -0.99 | 1.13 | 37630 | 21444 | 16121 | 65 |
| Day 1 forecast | -0.99 | 1.13 | 37630 | 21405 | 16158 | 67 |
| Day 4 forecast | -1 | 1.14 | 37630 | 21690 | 15876 | 64 |
| Day 7 forecast | -0.97 | 1.11 | 37630 | 20836 | 16730 | 64 |
| Day 10 forecast | -1 | 1.14 | 37630 | 21752 | 15817 | 61 |
Numbers in the three rightmost columns are grid counts. Regions with high/low sea ice thickness correspond to areas with model offsets from the gridded observations outside of one standard deviation. (Standard deviations are provided in the observational product.)
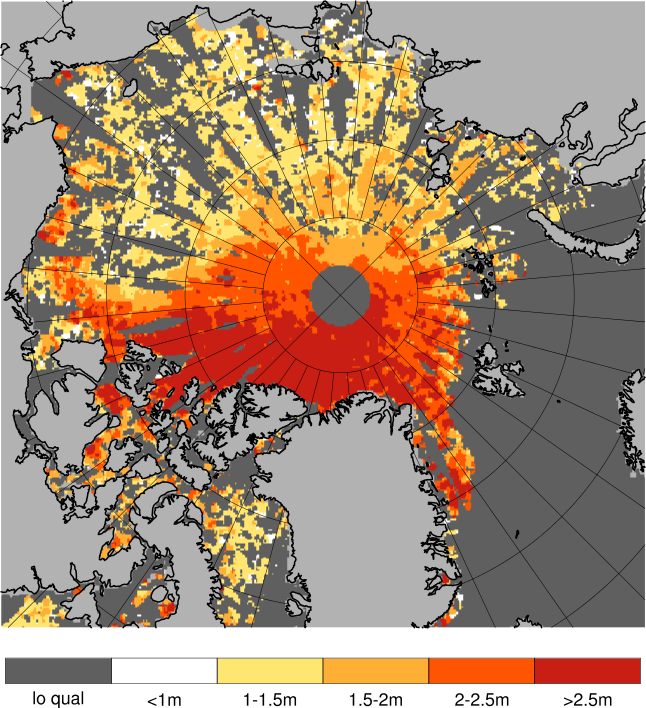
Definition of categories:
| Category | Sea ice thickness |
|---|---|
| c1 | <1m |
| c2 | 1 - 1.5m |
| c3 | 1.5 - 2m |
| c4 | 2 - 2.5m |
| c5 | 2.5 - 3m |
| c6 | >3m |
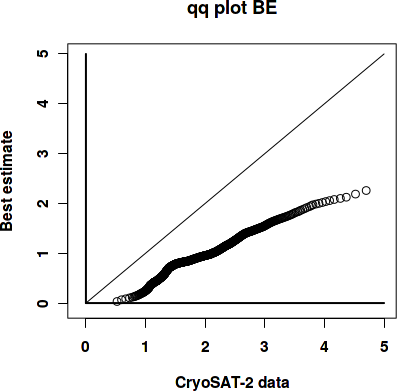
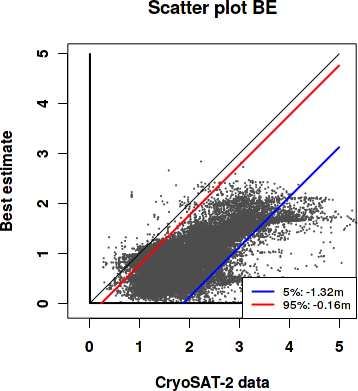
Best estimate vs. observations
Contingency table
| observations | |||||||||
|---|---|---|---|---|---|---|---|---|---|
| open | c1 | c2 | c3 | c4 | c5 | c6 | |||
| m o d e l |
open | 0 | 0 | 0 | 0 | 0 | 0 | 0 | |
| c1 | 0 | 0.036 | 0.318 | 0.198 | 0.075 | 0.02 | 0.005 | ||
| c2 | 0 | 0.001 | 0.016 | 0.039 | 0.102 | 0.076 | 0.016 | ||
| c3 | 0 | 0 | 0 | 0.001 | 0.011 | 0.022 | 0.05 | ||
| c4 | 0 | 0 | 0 | 0 | 0.001 | 0.003 | 0.008 | ||
| c5 | 0 | 0 | 0 | 0 | 0 | 0 | 0 | ||
| c6 | 0 | 0 | 0 | 0 | 0 | 0 | 0 | ||
See category definitions for details.
Statistical distribution
|
|
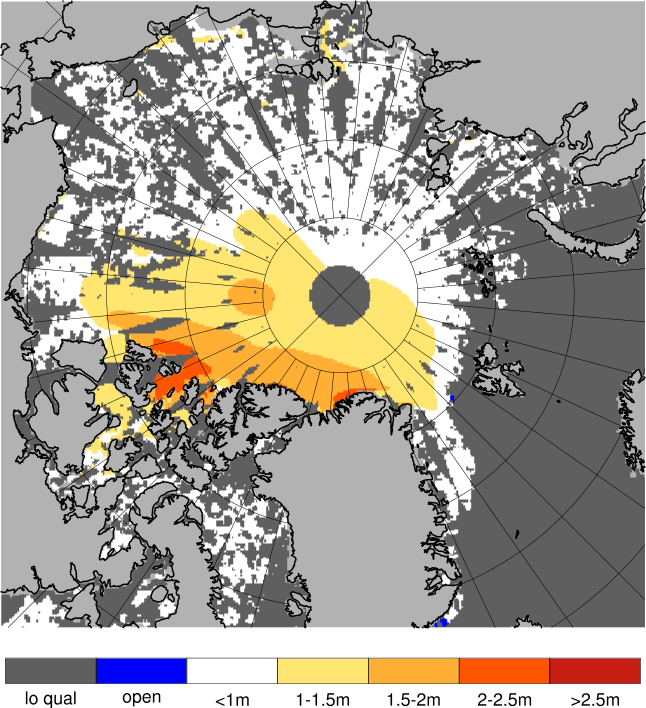
Observed sea ice thickness from CryoSAT
Sea ice thickness, best estimate product

Day 1 forecast vs. observations
Contingency table
| observations | |||||||||
|---|---|---|---|---|---|---|---|---|---|
| open | c1 | c2 | c3 | c4 | c5 | c6 | |||
| m o d e l |
open | 0 | 0 | 0 | 0 | 0 | 0 | 0 | |
| c1 | 0 | 0.036 | 0.317 | 0.197 | 0.077 | 0.019 | 0.006 | ||
| c2 | 0 | 0.001 | 0.016 | 0.04 | 0.098 | 0.076 | 0.016 | ||
| c3 | 0 | 0 | 0 | 0.001 | 0.014 | 0.023 | 0.049 | ||
| c4 | 0 | 0 | 0 | 0 | 0.001 | 0.003 | 0.009 | ||
| c5 | 0 | 0 | 0 | 0 | 0 | 0 | 0 | ||
| c6 | 0 | 0 | 0 | 0 | 0 | 0 | 0 | ||
See category definitions for details.
Statistical distribution

|

|
Sea ice thickness, day 1 forecast

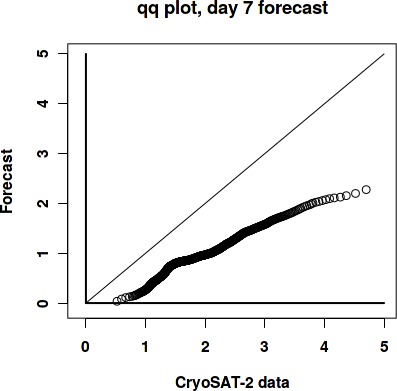
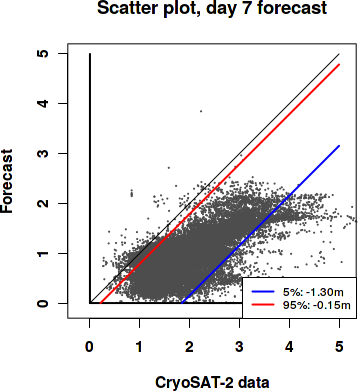
Day 7 forecast vs. observations
Contingency table
| observations | |||||||||
|---|---|---|---|---|---|---|---|---|---|
| open | c1 | c2 | c3 | c4 | c5 | c6 | |||
| m o d e l |
open | 0 | 0 | 0 | 0 | 0 | 0 | 0 | |
| c1 | 0 | 0.036 | 0.314 | 0.195 | 0.072 | 0.017 | 0.005 | ||
| c2 | 0 | 0.001 | 0.02 | 0.042 | 0.1 | 0.075 | 0.014 | ||
| c3 | 0 | 0 | 0 | 0.001 | 0.017 | 0.025 | 0.05 | ||
| c4 | 0 | 0 | 0 | 0 | 0.001 | 0.004 | 0.01 | ||
| c5 | 0 | 0 | 0 | 0 | 0 | 0 | 0 | ||
| c6 | 0 | 0 | 0 | 0 | 0 | 0 | 0 | ||
See category definitions for details.
Statistical distribution
|
|
Sea ice thickness, day 7 forecast
Generated by /metno/routine/sms/V2/SIthickness/c2iceWebPage.sh Fri Jan 18 03:54:02 UTC 2019 on arcmfcval