Validation of ice thickness - Full domain
Bulletin date: 2018-11-22
Model: ARC MFC - TOPAZ
Data source: UCL CryoSAT-2 sea ice thickness
Validation statistics summary
| Bias (m) | RMS (m) | total grids | low SIT | OK SIT | high SIT | |
|---|---|---|---|---|---|---|
| Best estimate | -1.27 | 1.4 | 29210 | 25808 | 3380 | 22 |
| Day 1 forecast | -1.27 | 1.4 | 29210 | 25788 | 3400 | 22 |
| Day 4 forecast | -1.28 | 1.4 | 29210 | 26039 | 3149 | 22 |
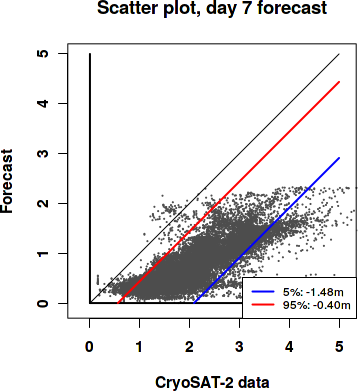
| Day 7 forecast | -1.25 | 1.38 | 29210 | 25278 | 3908 | 24 |
| Day 10 forecast | -1.28 | 1.41 | 29210 | 26274 | 2914 | 22 |
Numbers in the three rightmost columns are grid counts. Regions with high/low sea ice thickness correspond to areas with model offsets from the gridded observations outside of one standard deviation. (Standard deviations are provided in the observational product.)
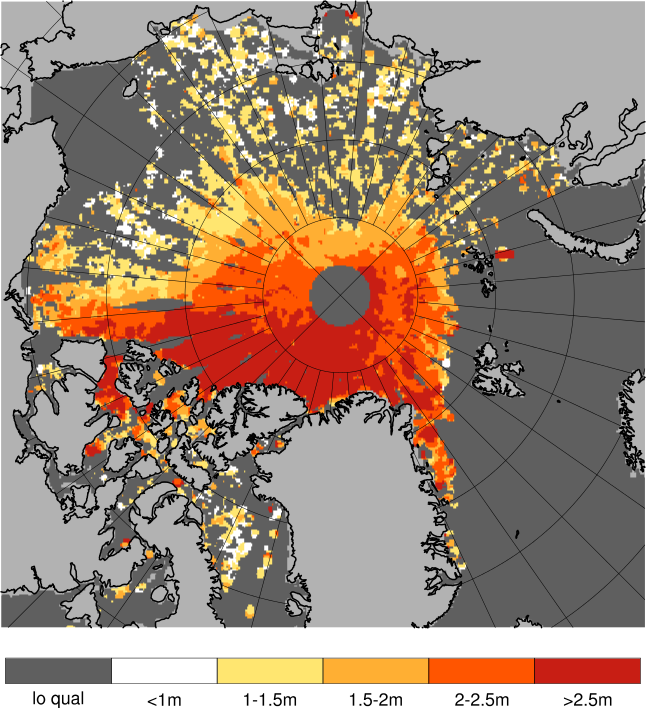
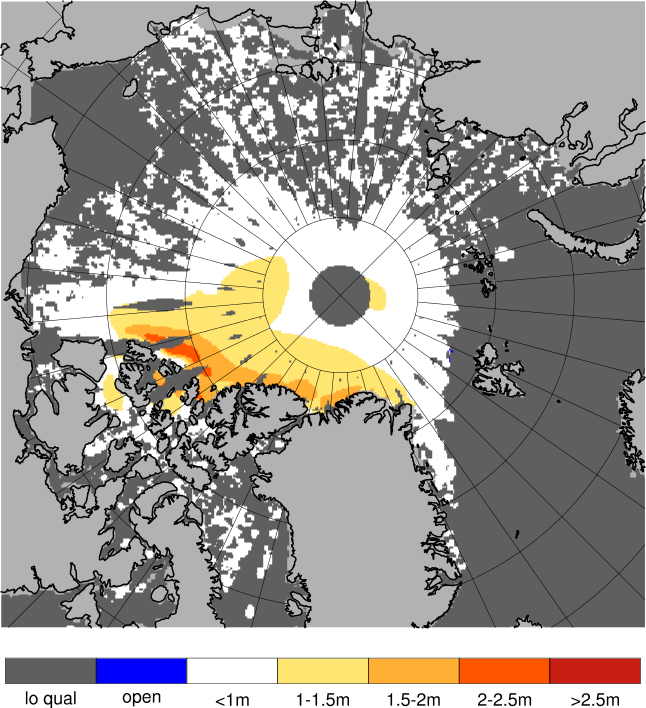
Definition of categories:
| Category | Sea ice thickness |
|---|---|
| c1 | <1m |
| c2 | 1 - 1.5m |
| c3 | 1.5 - 2m |
| c4 | 2 - 2.5m |
| c5 | 2.5 - 3m |
| c6 | >3m |
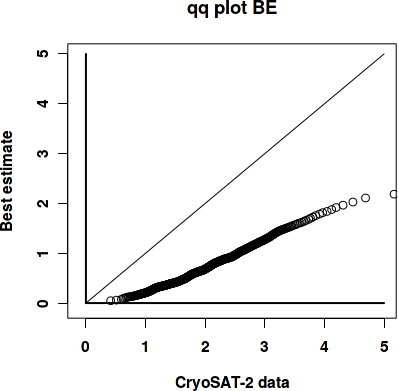
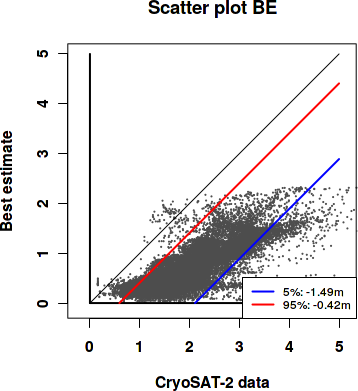
Best estimate vs. observations
Contingency table
| observations | |||||||||
|---|---|---|---|---|---|---|---|---|---|
| open | c1 | c2 | c3 | c4 | c5 | c6 | |||
| m o d e l |
open | 0 | 0 | 0 | 0 | 0 | 0 | 0 | |
| c1 | 0 | 0.072 | 0.26 | 0.21 | 0.16 | 0.07 | 0.01 | ||
| c2 | 0 | 0 | 0 | 0.005 | 0.05 | 0.053 | 0.064 | ||
| c3 | 0 | 0 | 0.001 | 0.002 | 0.003 | 0.011 | 0.023 | ||
| c4 | 0 | 0 | 0 | 0 | 0 | 0.001 | 0.005 | ||
| c5 | 0 | 0 | 0 | 0 | 0 | 0 | 0 | ||
| c6 | 0 | 0 | 0 | 0 | 0 | 0 | 0 | ||
See category definitions for details.
Statistical distribution
|
|
Observed sea ice thickness from CryoSAT
Sea ice thickness, best estimate product

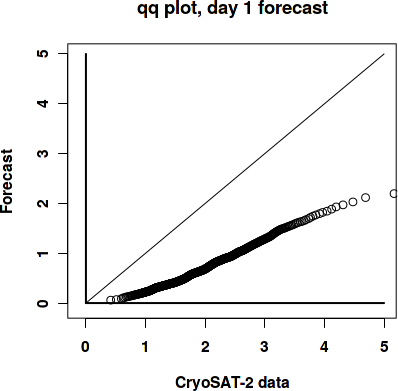
Day 1 forecast vs. observations
Contingency table
| observations | |||||||||
|---|---|---|---|---|---|---|---|---|---|
| open | c1 | c2 | c3 | c4 | c5 | c6 | |||
| m o d e l |
open | 0 | 0 | 0 | 0 | 0 | 0 | 0 | |
| c1 | 0 | 0.072 | 0.26 | 0.21 | 0.156 | 0.066 | 0.01 | ||
| c2 | 0 | 0 | 0 | 0.005 | 0.054 | 0.057 | 0.061 | ||
| c3 | 0 | 0 | 0.001 | 0.002 | 0.003 | 0.011 | 0.026 | ||
| c4 | 0 | 0 | 0 | 0 | 0 | 0.001 | 0.005 | ||
| c5 | 0 | 0 | 0 | 0 | 0 | 0 | 0 | ||
| c6 | 0 | 0 | 0 | 0 | 0 | 0 | 0 | ||
See category definitions for details.
Statistical distribution
|

|
Sea ice thickness, day 1 forecast
Day 7 forecast vs. observations
Contingency table
| observations | |||||||||
|---|---|---|---|---|---|---|---|---|---|
| open | c1 | c2 | c3 | c4 | c5 | c6 | |||
| m o d e l |
open | 0 | 0 | 0 | 0 | 0 | 0 | 0 | |
| c1 | 0 | 0.072 | 0.26 | 0.209 | 0.152 | 0.062 | 0.008 | ||
| c2 | 0 | 0 | 0 | 0.005 | 0.057 | 0.06 | 0.059 | ||
| c3 | 0 | 0 | 0.001 | 0.002 | 0.003 | 0.011 | 0.029 | ||
| c4 | 0 | 0 | 0 | 0 | 0 | 0.001 | 0.006 | ||
| c5 | 0 | 0 | 0 | 0 | 0 | 0 | 0 | ||
| c6 | 0 | 0 | 0 | 0 | 0 | 0 | 0 | ||
See category definitions for details.
Statistical distribution

|
|
Sea ice thickness, day 7 forecast

Generated by /metno/routine/sms/V2/SIthickness/c2iceWebPage.sh Fri Dec 7 03:53:41 UTC 2018 on arcmfcval