Validation of ice thickness - Full domain
Bulletin date: 2018-11-15
Model: ARC MFC - TOPAZ
Data source: UCL CryoSAT-2 sea ice thickness
Validation statistics summary
| Bias (m) | RMS (m) | total grids | low SIT | OK SIT | high SIT | |
|---|---|---|---|---|---|---|
| Best estimate | -1.3 | 1.4 | 28354 | 26222 | 2128 | 4 |
| Day 1 forecast | -1.29 | 1.39 | 28354 | 26140 | 2210 | 4 |
| Day 4 forecast | -1.3 | 1.4 | 28354 | 26288 | 2062 | 4 |
| Day 7 forecast | -1.28 | 1.38 | 28354 | 25879 | 2471 | 4 |
| Day 10 forecast | -1.29 | 1.39 | 28354 | 26208 | 2144 | 2 |
Numbers in the three rightmost columns are grid counts. Regions with high/low sea ice thickness correspond to areas with model offsets from the gridded observations outside of one standard deviation. (Standard deviations are provided in the observational product.)
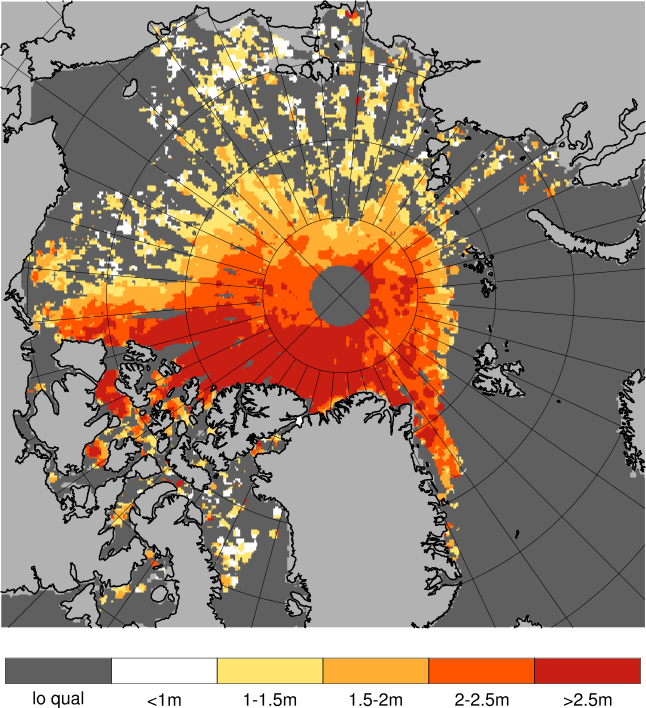
Definition of categories:
| Category | Sea ice thickness |
|---|---|
| c1 | <1m |
| c2 | 1 - 1.5m |
| c3 | 1.5 - 2m |
| c4 | 2 - 2.5m |
| c5 | 2.5 - 3m |
| c6 | >3m |
Best estimate vs. observations
Contingency table
| observations | |||||||||
|---|---|---|---|---|---|---|---|---|---|
| open | c1 | c2 | c3 | c4 | c5 | c6 | |||
| m o d e l |
open | 0 | 0 | 0 | 0 | 0 | 0 | 0 | |
| c1 | 0 | 0.075 | 0.249 | 0.21 | 0.178 | 0.076 | 0.01 | ||
| c2 | 0 | 0 | 0 | 0.004 | 0.04 | 0.051 | 0.057 | ||
| c3 | 0 | 0 | 0 | 0.003 | 0.005 | 0.013 | 0.02 | ||
| c4 | 0 | 0 | 0 | 0 | 0.001 | 0.002 | 0.006 | ||
| c5 | 0 | 0 | 0 | 0 | 0 | 0 | 0 | ||
| c6 | 0 | 0 | 0 | 0 | 0 | 0 | 0 | ||
See category definitions for details.
Statistical distribution
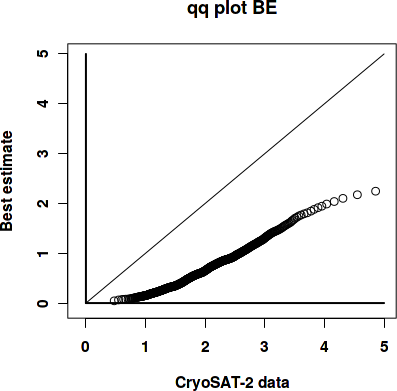
|
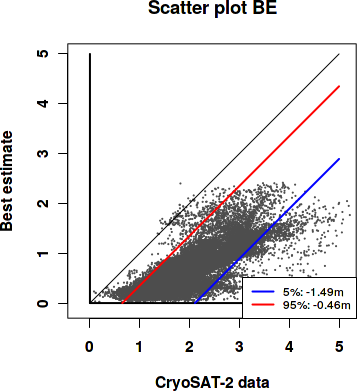
|
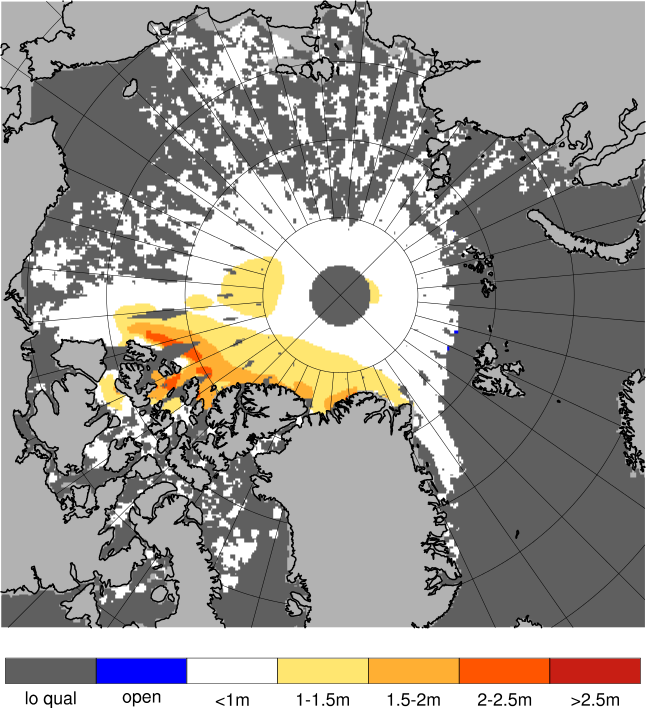
Observed sea ice thickness from CryoSAT
Sea ice thickness, best estimate product

Day 1 forecast vs. observations
Contingency table
| observations | |||||||||
|---|---|---|---|---|---|---|---|---|---|
| open | c1 | c2 | c3 | c4 | c5 | c6 | |||
| m o d e l |
open | 0 | 0 | 0 | 0 | 0 | 0 | 0 | |
| c1 | 0 | 0.075 | 0.249 | 0.209 | 0.174 | 0.076 | 0.01 | ||
| c2 | 0 | 0 | 0 | 0.005 | 0.043 | 0.051 | 0.054 | ||
| c3 | 0 | 0 | 0 | 0.003 | 0.005 | 0.014 | 0.022 | ||
| c4 | 0 | 0 | 0 | 0 | 0.001 | 0.002 | 0.006 | ||
| c5 | 0 | 0 | 0 | 0 | 0 | 0 | 0 | ||
| c6 | 0 | 0 | 0 | 0 | 0 | 0 | 0 | ||
See category definitions for details.
Statistical distribution
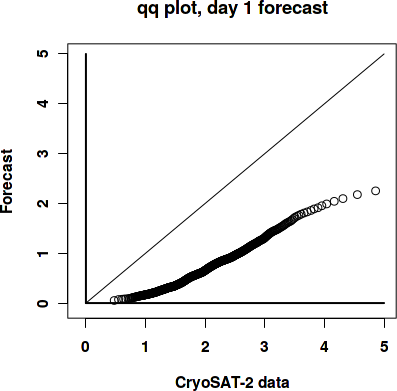
|
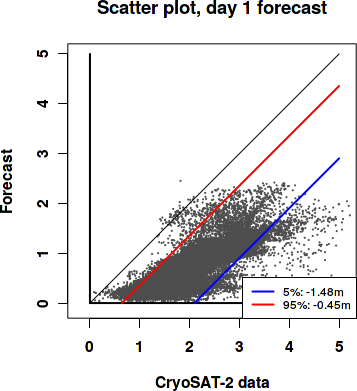
|
Sea ice thickness, day 1 forecast
Day 7 forecast vs. observations
Contingency table
| observations | |||||||||
|---|---|---|---|---|---|---|---|---|---|
| open | c1 | c2 | c3 | c4 | c5 | c6 | |||
| m o d e l |
open | 0 | 0 | 0 | 0 | 0 | 0 | 0 | |
| c1 | 0 | 0.075 | 0.249 | 0.209 | 0.172 | 0.071 | 0.008 | ||
| c2 | 0 | 0 | 0 | 0.005 | 0.046 | 0.055 | 0.056 | ||
| c3 | 0 | 0 | 0 | 0.003 | 0.005 | 0.014 | 0.023 | ||
| c4 | 0 | 0 | 0 | 0 | 0.001 | 0.002 | 0.006 | ||
| c5 | 0 | 0 | 0 | 0 | 0 | 0 | 0 | ||
| c6 | 0 | 0 | 0 | 0 | 0 | 0 | 0 | ||
See category definitions for details.
Statistical distribution

|
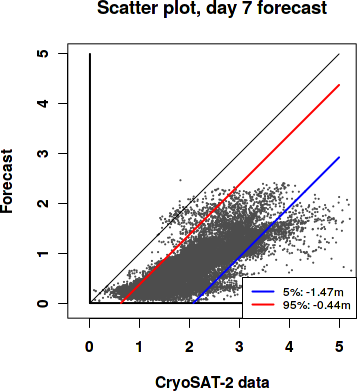
|
Sea ice thickness, day 7 forecast

Generated by /metno/routine/sms/V2/SIthickness/c2iceWebPage.sh Fri Nov 30 03:54:33 UTC 2018 on arcmfcval