Validation of ice thickness - Full domain
Bulletin date: 2018-05-24
Model: ARC MFC - TOPAZ
Data source: UCL CryoSAT-2 sea ice thickness
Validation statistics summary
| Bias (m) | RMS (m) | total grids | low SIT | OK SIT | high SIT | |
|---|---|---|---|---|---|---|
| Best estimate | -1.06 | 1.21 | 28184 | 12073 | 16069 | 42 |
| Day 1 forecast | -1.06 | 1.21 | 28184 | 12056 | 16087 | 41 |
| Day 4 forecast | -1.06 | 1.21 | 28184 | 12076 | 16068 | 40 |
| Day 7 forecast | -1.06 | 1.21 | 28184 | 12037 | 16102 | 45 |
| Day 10 forecast | -1.06 | 1.21 | 28184 | 12104 | 16043 | 37 |
Numbers in the three rightmost columns are grid counts. Regions with high/low sea ice thickness correspond to areas with model offsets from the gridded observations outside of one standard deviation. (Standard deviations are provided in the observational product.)
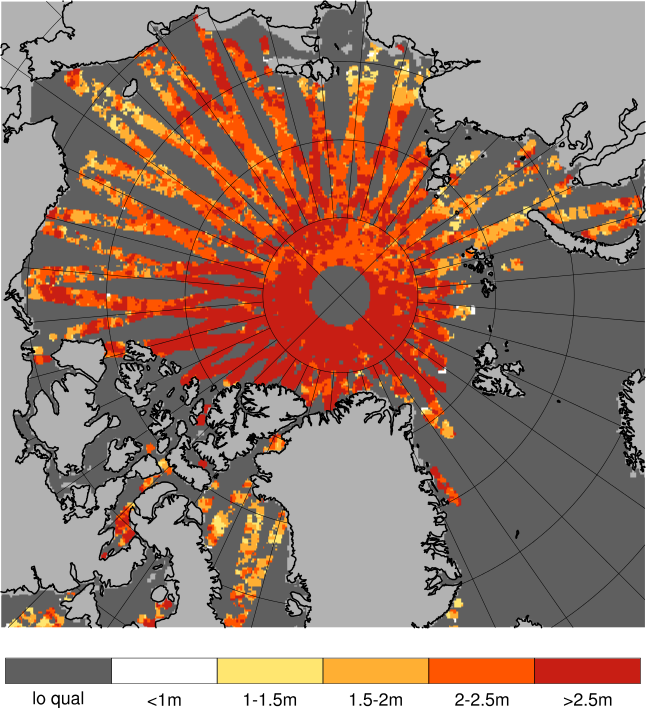
Definition of categories:
| Category | Sea ice thickness |
|---|---|
| c1 | <1m |
| c2 | 1 - 1.5m |
| c3 | 1.5 - 2m |
| c4 | 2 - 2.5m |
| c5 | 2.5 - 3m |
| c6 | >3m |
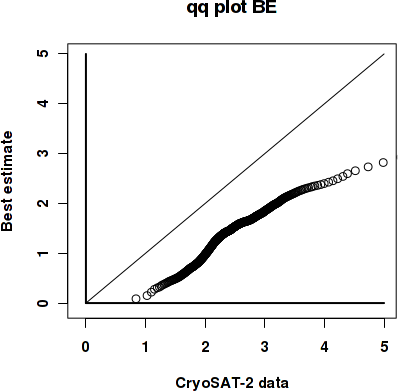
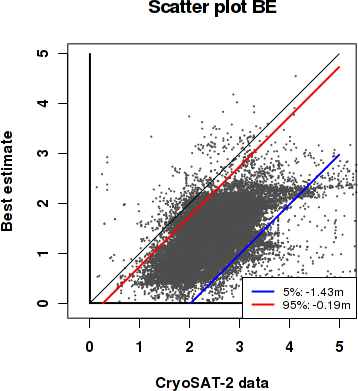
Best estimate vs. observations
Contingency table
| observations | |||||||||
|---|---|---|---|---|---|---|---|---|---|
| open | c1 | c2 | c3 | c4 | c5 | c6 | |||
| m o d e l |
open | 0 | 0 | 0 | 0 | 0 | 0 | 0 | |
| c1 | 0 | 0.003 | 0.029 | 0.096 | 0.06 | 0.028 | 0.011 | ||
| c2 | 0 | 0 | 0.004 | 0.049 | 0.126 | 0.09 | 0.035 | ||
| c3 | 0 | 0 | 0.001 | 0.031 | 0.143 | 0.112 | 0.069 | ||
| c4 | 0 | 0 | 0 | 0.002 | 0.017 | 0.025 | 0.052 | ||
| c5 | 0 | 0 | 0 | 0.001 | 0.001 | 0.002 | 0.008 | ||
| c6 | 0 | 0 | 0 | 0 | 0.001 | 0.001 | 0.002 | ||
See category definitions for details.
Statistical distribution
|
|
Observed sea ice thickness from CryoSAT
Sea ice thickness, best estimate product

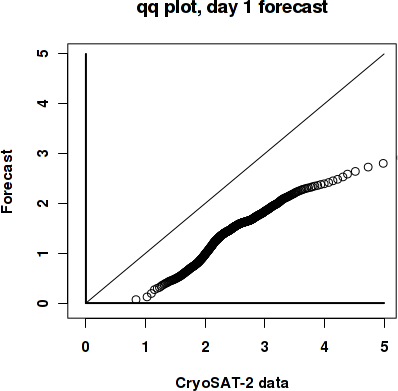
Day 1 forecast vs. observations
Contingency table
| observations | |||||||||
|---|---|---|---|---|---|---|---|---|---|
| open | c1 | c2 | c3 | c4 | c5 | c6 | |||
| m o d e l |
open | 0 | 0 | 0 | 0.001 | 0 | 0 | 0 | |
| c1 | 0 | 0.003 | 0.029 | 0.095 | 0.059 | 0.027 | 0.011 | ||
| c2 | 0 | 0 | 0.004 | 0.048 | 0.127 | 0.09 | 0.036 | ||
| c3 | 0 | 0 | 0.001 | 0.032 | 0.145 | 0.114 | 0.07 | ||
| c4 | 0 | 0 | 0 | 0.002 | 0.015 | 0.025 | 0.051 | ||
| c5 | 0 | 0 | 0 | 0.001 | 0.001 | 0.001 | 0.008 | ||
| c6 | 0 | 0 | 0 | 0 | 0.001 | 0.001 | 0.002 | ||
See category definitions for details.
Statistical distribution
|
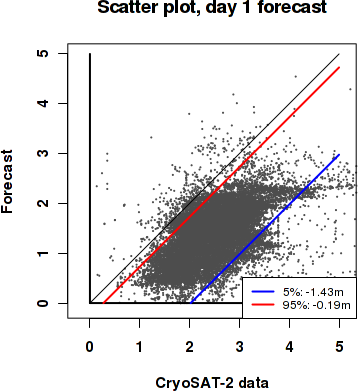
|
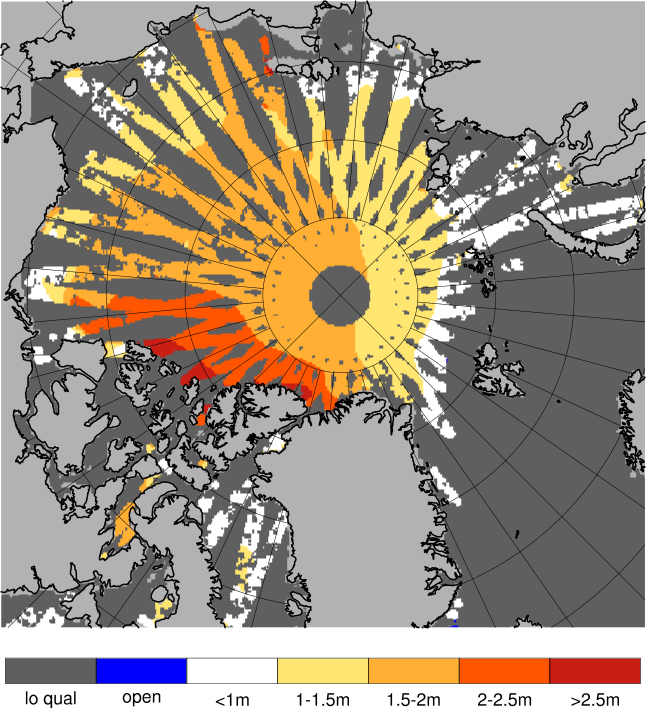
Sea ice thickness, day 1 forecast
Day 7 forecast vs. observations
Contingency table
| observations | |||||||||
|---|---|---|---|---|---|---|---|---|---|
| open | c1 | c2 | c3 | c4 | c5 | c6 | |||
| m o d e l |
open | 0 | 0 | 0 | 0.001 | 0 | 0 | 0 | |
| c1 | 0 | 0.002 | 0.029 | 0.095 | 0.059 | 0.027 | 0.011 | ||
| c2 | 0 | 0 | 0.004 | 0.048 | 0.127 | 0.089 | 0.036 | ||
| c3 | 0 | 0 | 0.001 | 0.031 | 0.145 | 0.114 | 0.07 | ||
| c4 | 0 | 0 | 0 | 0.002 | 0.016 | 0.025 | 0.051 | ||
| c5 | 0 | 0 | 0 | 0.001 | 0.001 | 0.001 | 0.008 | ||
| c6 | 0 | 0 | 0 | 0 | 0.001 | 0.001 | 0.002 | ||
See category definitions for details.
Statistical distribution

|
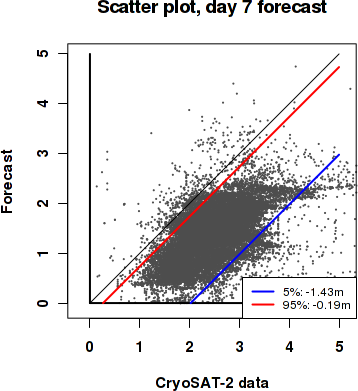
|
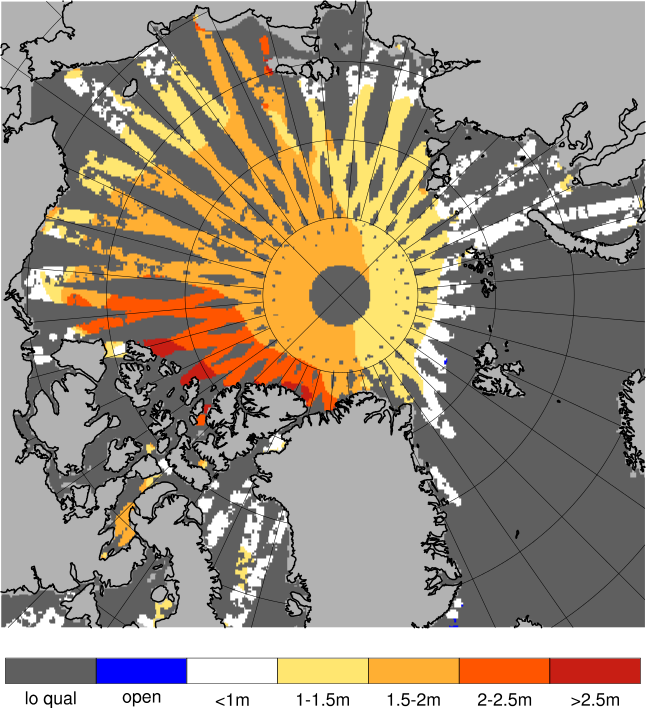
Sea ice thickness, day 7 forecast
Generated by /metno/routine/sms/V2/SIthickness/c2iceWebPage.sh Fri Jun 8 03:52:23 UTC 2018 on arcmfcval