Validation of ice thickness - Full domain
Bulletin date: 2018-05-17
Model: ARC MFC - TOPAZ
Data source: UCL CryoSAT-2 sea ice thickness
Validation statistics summary
| Bias (m) | RMS (m) | total grids | low SIT | OK SIT | high SIT | |
|---|---|---|---|---|---|---|
| Best estimate | -1.05 | 1.2 | 41468 | 16879 | 24552 | 37 |
| Day 1 forecast | -1.05 | 1.2 | 41468 | 16852 | 24583 | 33 |
| Day 4 forecast | -1.05 | 1.2 | 41468 | 16875 | 24558 | 35 |
| Day 7 forecast | -1.05 | 1.2 | 41468 | 16813 | 24619 | 36 |
| Day 10 forecast | -1.06 | 1.2 | 41468 | 16939 | 24497 | 32 |
Numbers in the three rightmost columns are grid counts. Regions with high/low sea ice thickness correspond to areas with model offsets from the gridded observations outside of one standard deviation. (Standard deviations are provided in the observational product.)
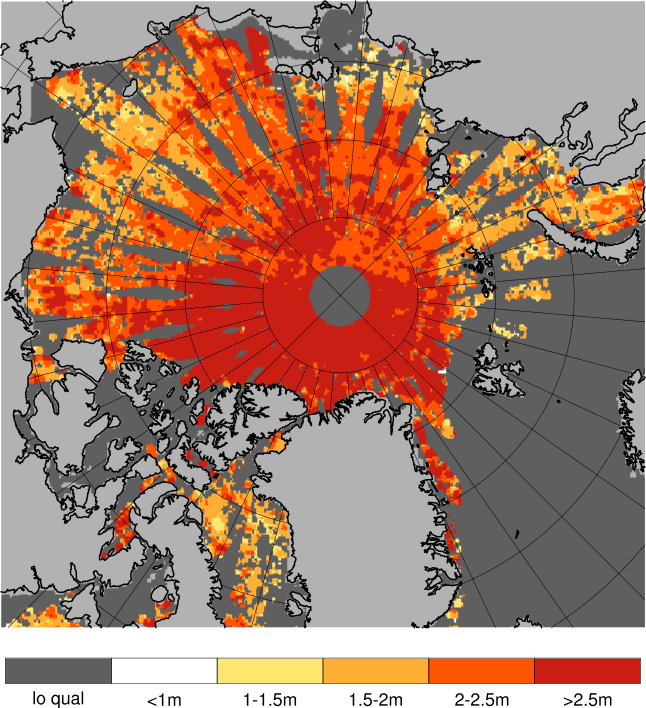
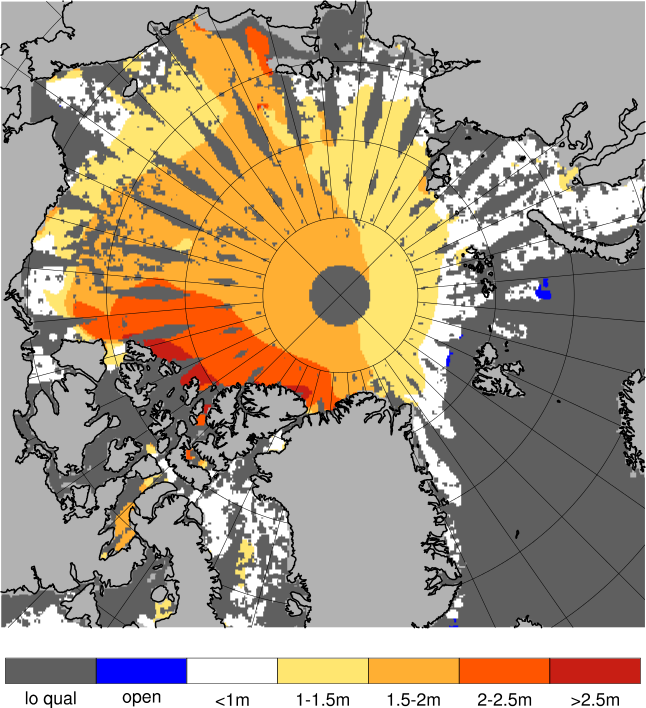
Definition of categories:
| Category | Sea ice thickness |
|---|---|
| c1 | <1m |
| c2 | 1 - 1.5m |
| c3 | 1.5 - 2m |
| c4 | 2 - 2.5m |
| c5 | 2.5 - 3m |
| c6 | >3m |
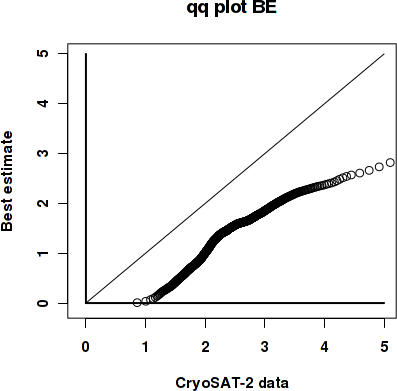
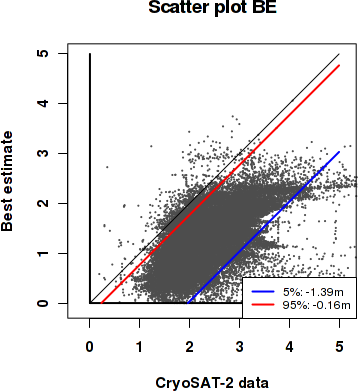
Best estimate vs. observations
Contingency table
| observations | |||||||||
|---|---|---|---|---|---|---|---|---|---|
| open | c1 | c2 | c3 | c4 | c5 | c6 | |||
| m o d e l |
open | 0 | 0 | 0 | 0.001 | 0 | 0 | 0 | |
| c1 | 0 | 0.002 | 0.038 | 0.137 | 0.069 | 0.024 | 0.012 | ||
| c2 | 0 | 0 | 0.005 | 0.058 | 0.119 | 0.071 | 0.027 | ||
| c3 | 0 | 0 | 0.002 | 0.04 | 0.129 | 0.091 | 0.062 | ||
| c4 | 0 | 0 | 0 | 0.002 | 0.015 | 0.025 | 0.057 | ||
| c5 | 0 | 0 | 0 | 0 | 0.001 | 0.001 | 0.008 | ||
| c6 | 0 | 0 | 0 | 0 | 0 | 0 | 0.001 | ||
See category definitions for details.
Statistical distribution
|
|
Observed sea ice thickness from CryoSAT
Sea ice thickness, best estimate product

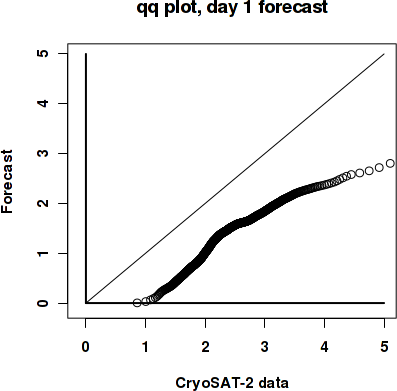
Day 1 forecast vs. observations
Contingency table
| observations | |||||||||
|---|---|---|---|---|---|---|---|---|---|
| open | c1 | c2 | c3 | c4 | c5 | c6 | |||
| m o d e l |
open | 0 | 0 | 0 | 0.001 | 0 | 0 | 0 | |
| c1 | 0 | 0.002 | 0.038 | 0.137 | 0.069 | 0.024 | 0.012 | ||
| c2 | 0 | 0 | 0.005 | 0.058 | 0.118 | 0.071 | 0.027 | ||
| c3 | 0 | 0 | 0.002 | 0.04 | 0.131 | 0.093 | 0.063 | ||
| c4 | 0 | 0 | 0 | 0.002 | 0.013 | 0.023 | 0.056 | ||
| c5 | 0 | 0 | 0 | 0 | 0.001 | 0.001 | 0.008 | ||
| c6 | 0 | 0 | 0 | 0 | 0 | 0 | 0.001 | ||
See category definitions for details.
Statistical distribution
|

|
Sea ice thickness, day 1 forecast

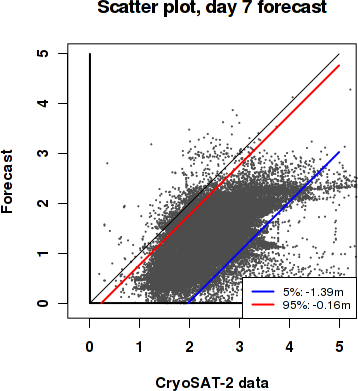
Day 7 forecast vs. observations
Contingency table
| observations | |||||||||
|---|---|---|---|---|---|---|---|---|---|
| open | c1 | c2 | c3 | c4 | c5 | c6 | |||
| m o d e l |
open | 0 | 0 | 0 | 0.002 | 0 | 0 | 0 | |
| c1 | 0 | 0.002 | 0.038 | 0.136 | 0.068 | 0.024 | 0.012 | ||
| c2 | 0 | 0 | 0.005 | 0.058 | 0.119 | 0.07 | 0.027 | ||
| c3 | 0 | 0 | 0.002 | 0.04 | 0.132 | 0.094 | 0.064 | ||
| c4 | 0 | 0 | 0 | 0.002 | 0.014 | 0.023 | 0.056 | ||
| c5 | 0 | 0 | 0 | 0 | 0.001 | 0.001 | 0.007 | ||
| c6 | 0 | 0 | 0 | 0 | 0 | 0.001 | 0.001 | ||
See category definitions for details.
Statistical distribution

|
|
Sea ice thickness, day 7 forecast
Generated by /metno/routine/sms/V2/SIthickness/c2iceWebPage.sh Fri Jun 1 03:52:51 UTC 2018 on arcmfcval