Validation of ice thickness - Full domain
Bulletin date: 2018-04-19
Model: ARC MFC - TOPAZ
Data source: UCL CryoSAT-2 sea ice thickness
Validation statistics summary
| Bias (m) | RMS (m) | total grids | low SIT | OK SIT | high SIT | |
|---|---|---|---|---|---|---|
| Best estimate | -0.93 | 1.08 | 42993 | 17382 | 25573 | 38 |
| Day 1 forecast | -0.92 | 1.07 | 42993 | 16972 | 25983 | 38 |
| Day 4 forecast | -0.92 | 1.07 | 42993 | 16959 | 25996 | 38 |
| Day 7 forecast | -0.91 | 1.06 | 42993 | 16619 | 26331 | 43 |
| Day 10 forecast | -0.92 | 1.06 | 42993 | 16717 | 26243 | 33 |
Numbers in the three rightmost columns are grid counts. Regions with high/low sea ice thickness correspond to areas with model offsets from the gridded observations outside of one standard deviation. (Standard deviations are provided in the observational product.)
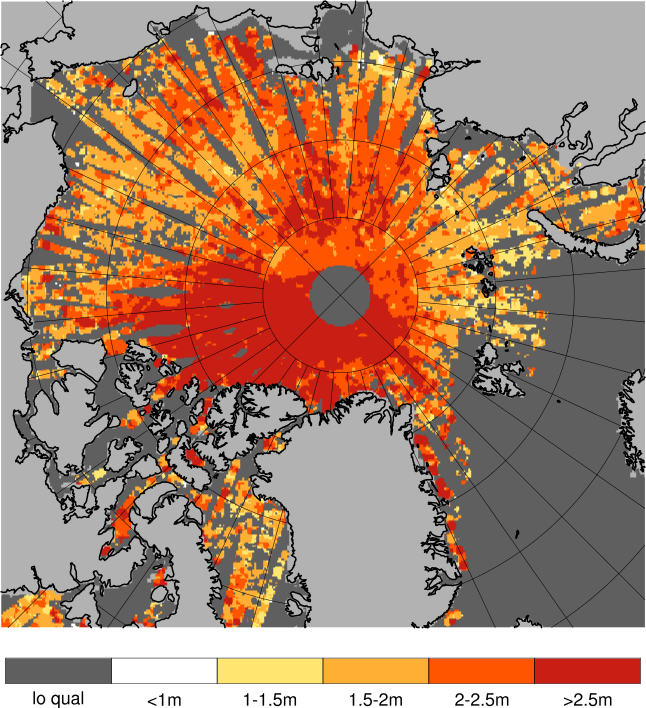
Definition of categories:
| Category | Sea ice thickness |
|---|---|
| c1 | <1m |
| c2 | 1 - 1.5m |
| c3 | 1.5 - 2m |
| c4 | 2 - 2.5m |
| c5 | 2.5 - 3m |
| c6 | >3m |
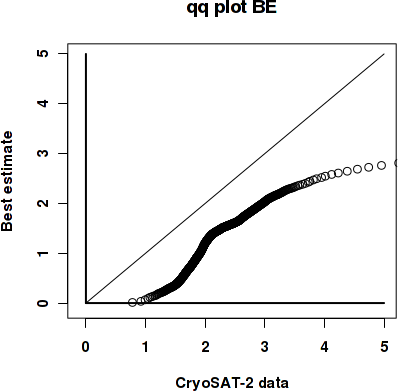
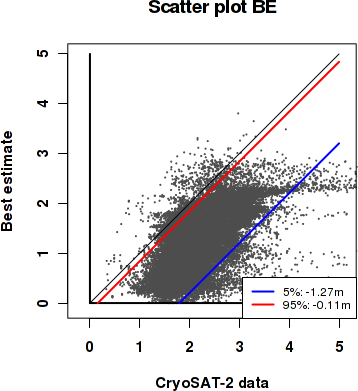
Best estimate vs. observations
Contingency table
| observations | |||||||||
|---|---|---|---|---|---|---|---|---|---|
| open | c1 | c2 | c3 | c4 | c5 | c6 | |||
| m o d e l |
open | 0 | 0 | 0 | 0.001 | 0 | 0 | 0 | |
| c1 | 0 | 0.003 | 0.055 | 0.167 | 0.073 | 0.018 | 0.008 | ||
| c2 | 0 | 0 | 0.006 | 0.082 | 0.135 | 0.047 | 0.005 | ||
| c3 | 0 | 0 | 0.003 | 0.075 | 0.114 | 0.069 | 0.037 | ||
| c4 | 0 | 0 | 0 | 0.003 | 0.013 | 0.037 | 0.034 | ||
| c5 | 0 | 0 | 0 | 0.001 | 0.002 | 0.004 | 0.006 | ||
| c6 | 0 | 0 | 0 | 0 | 0 | 0 | 0 | ||
See category definitions for details.
Statistical distribution
|
|
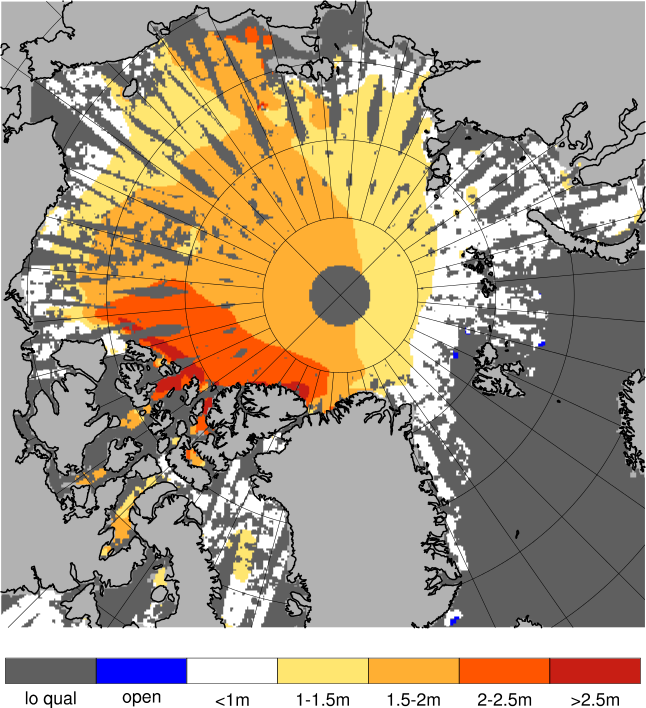
Observed sea ice thickness from CryoSAT
Sea ice thickness, best estimate product

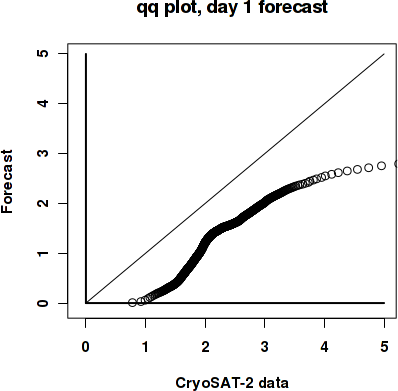
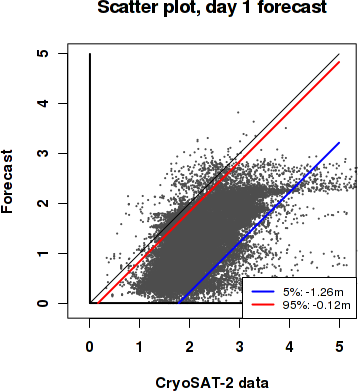
Day 1 forecast vs. observations
Contingency table
| observations | |||||||||
|---|---|---|---|---|---|---|---|---|---|
| open | c1 | c2 | c3 | c4 | c5 | c6 | |||
| m o d e l |
open | 0 | 0 | 0 | 0.001 | 0 | 0 | 0 | |
| c1 | 0 | 0.003 | 0.055 | 0.164 | 0.071 | 0.017 | 0.008 | ||
| c2 | 0 | 0 | 0.007 | 0.084 | 0.136 | 0.048 | 0.005 | ||
| c3 | 0 | 0 | 0.003 | 0.077 | 0.117 | 0.07 | 0.038 | ||
| c4 | 0 | 0 | 0 | 0.002 | 0.012 | 0.036 | 0.034 | ||
| c5 | 0 | 0 | 0 | 0.001 | 0.002 | 0.004 | 0.006 | ||
| c6 | 0 | 0 | 0 | 0 | 0 | 0 | 0 | ||
See category definitions for details.
Statistical distribution
|
|
Sea ice thickness, day 1 forecast
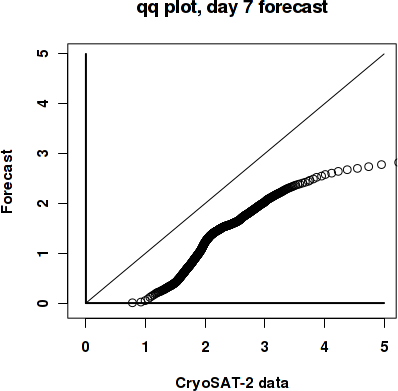
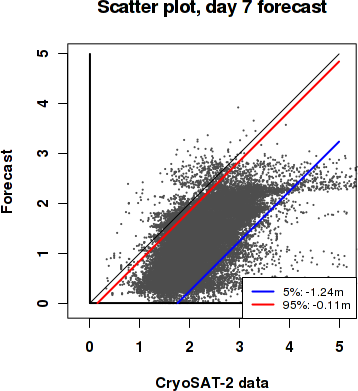
Day 7 forecast vs. observations
Contingency table
| observations | |||||||||
|---|---|---|---|---|---|---|---|---|---|
| open | c1 | c2 | c3 | c4 | c5 | c6 | |||
| m o d e l |
open | 0 | 0 | 0 | 0.001 | 0 | 0 | 0 | |
| c1 | 0 | 0.003 | 0.054 | 0.162 | 0.068 | 0.016 | 0.007 | ||
| c2 | 0 | 0 | 0.007 | 0.084 | 0.137 | 0.048 | 0.005 | ||
| c3 | 0 | 0 | 0.003 | 0.078 | 0.117 | 0.07 | 0.037 | ||
| c4 | 0 | 0 | 0 | 0.002 | 0.013 | 0.037 | 0.034 | ||
| c5 | 0 | 0 | 0 | 0.001 | 0.002 | 0.004 | 0.006 | ||
| c6 | 0 | 0 | 0 | 0 | 0 | 0 | 0 | ||
See category definitions for details.
Statistical distribution
|
|
Sea ice thickness, day 7 forecast

Generated by /metno/routine/sms/V2/SIthickness/c2iceWebPage.sh Fri May 4 03:53:51 UTC 2018 on arcmfcval