Validation of ice thickness - Full domain
Bulletin date: 2018-04-05
Model: ARC MFC - TOPAZ
Data source: UCL CryoSAT-2 sea ice thickness
Validation statistics summary
| Bias (m) | RMS (m) | total grids | low SIT | OK SIT | high SIT | |
|---|---|---|---|---|---|---|
| Best estimate | -0.95 | 1.1 | 47242 | 20059 | 27157 | 26 |
| Day 1 forecast | -0.95 | 1.1 | 47242 | 19823 | 27395 | 24 |
| Day 4 forecast | -0.95 | 1.1 | 47242 | 19948 | 27269 | 25 |
| Day 7 forecast | -0.93 | 1.09 | 47242 | 19370 | 27847 | 25 |
| Day 10 forecast | -0.94 | 1.09 | 47242 | 19396 | 27818 | 28 |
Numbers in the three rightmost columns are grid counts. Regions with high/low sea ice thickness correspond to areas with model offsets from the gridded observations outside of one standard deviation. (Standard deviations are provided in the observational product.)
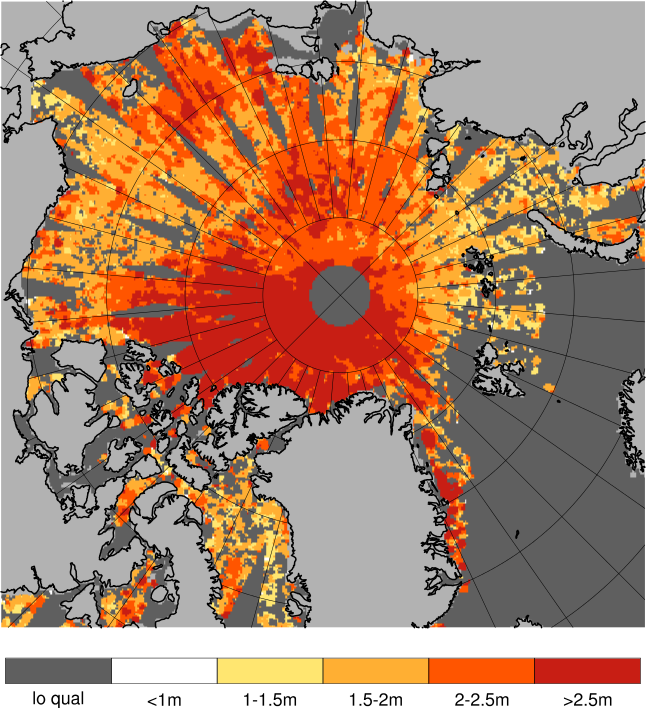
Definition of categories:
| Category | Sea ice thickness |
|---|---|
| c1 | <1m |
| c2 | 1 - 1.5m |
| c3 | 1.5 - 2m |
| c4 | 2 - 2.5m |
| c5 | 2.5 - 3m |
| c6 | >3m |
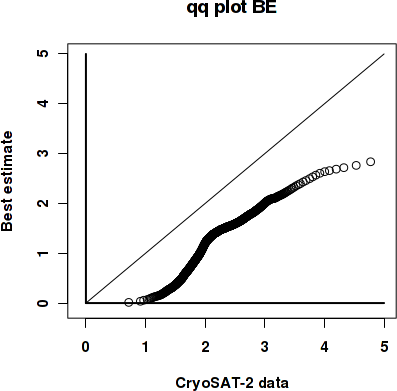
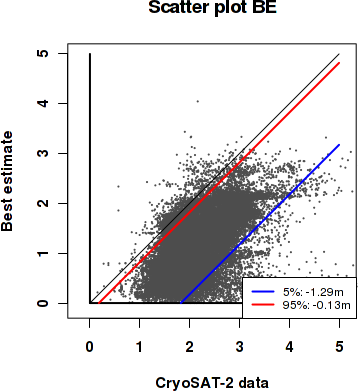
Best estimate vs. observations
Contingency table
| observations | |||||||||
|---|---|---|---|---|---|---|---|---|---|
| open | c1 | c2 | c3 | c4 | c5 | c6 | |||
| m o d e l |
open | 0 | 0 | 0 | 0 | 0 | 0 | 0 | |
| c1 | 0 | 0.004 | 0.068 | 0.178 | 0.072 | 0.021 | 0.012 | ||
| c2 | 0 | 0 | 0.006 | 0.107 | 0.133 | 0.045 | 0.005 | ||
| c3 | 0 | 0 | 0.002 | 0.058 | 0.101 | 0.07 | 0.035 | ||
| c4 | 0 | 0 | 0 | 0.002 | 0.013 | 0.032 | 0.024 | ||
| c5 | 0 | 0 | 0 | 0 | 0.002 | 0.003 | 0.005 | ||
| c6 | 0 | 0 | 0 | 0 | 0 | 0 | 0 | ||
See category definitions for details.
Statistical distribution
|
|
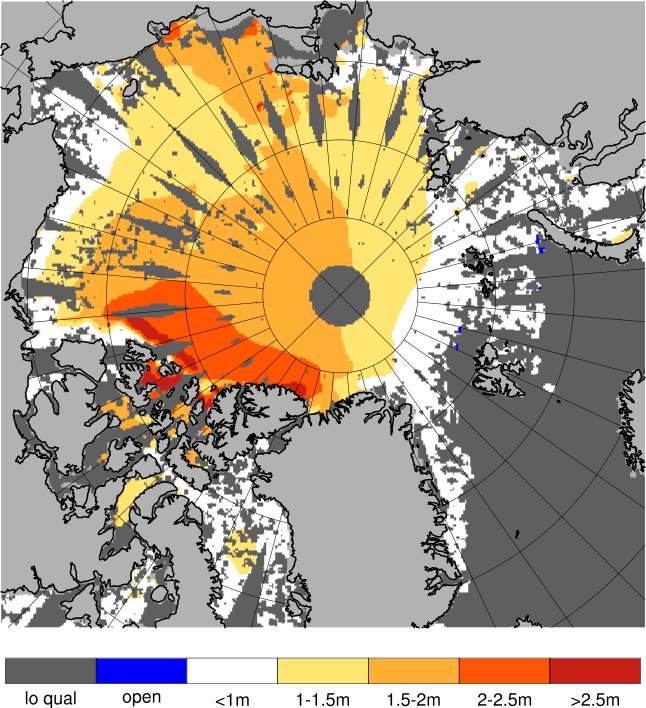
Observed sea ice thickness from CryoSAT
Sea ice thickness, best estimate product

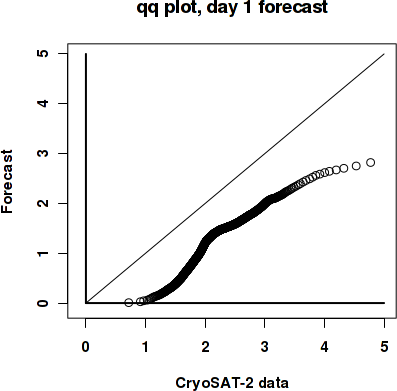
Day 1 forecast vs. observations
Contingency table
| observations | |||||||||
|---|---|---|---|---|---|---|---|---|---|
| open | c1 | c2 | c3 | c4 | c5 | c6 | |||
| m o d e l |
open | 0 | 0 | 0 | 0 | 0 | 0 | 0 | |
| c1 | 0 | 0.004 | 0.068 | 0.176 | 0.071 | 0.02 | 0.012 | ||
| c2 | 0 | 0 | 0.006 | 0.111 | 0.134 | 0.046 | 0.005 | ||
| c3 | 0 | 0 | 0.002 | 0.056 | 0.102 | 0.07 | 0.036 | ||
| c4 | 0 | 0 | 0 | 0.002 | 0.012 | 0.031 | 0.023 | ||
| c5 | 0 | 0 | 0 | 0 | 0.002 | 0.003 | 0.005 | ||
| c6 | 0 | 0 | 0 | 0 | 0 | 0 | 0 | ||
See category definitions for details.
Statistical distribution
|

|
Sea ice thickness, day 1 forecast
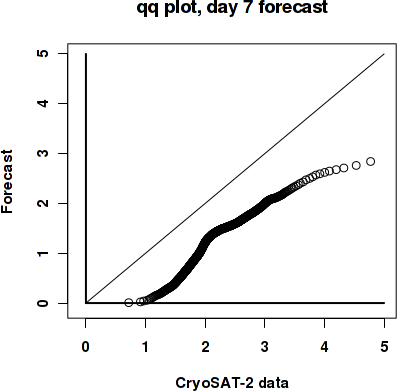
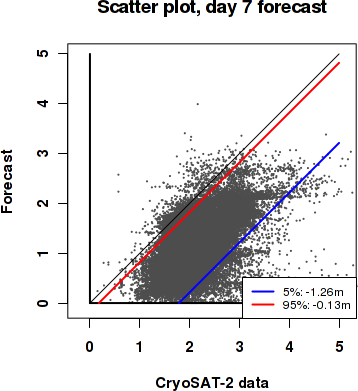
Day 7 forecast vs. observations
Contingency table
| observations | |||||||||
|---|---|---|---|---|---|---|---|---|---|
| open | c1 | c2 | c3 | c4 | c5 | c6 | |||
| m o d e l |
open | 0 | 0 | 0 | 0 | 0.001 | 0 | 0 | |
| c1 | 0 | 0.004 | 0.068 | 0.173 | 0.069 | 0.019 | 0.012 | ||
| c2 | 0 | 0 | 0.007 | 0.111 | 0.132 | 0.046 | 0.005 | ||
| c3 | 0 | 0 | 0.002 | 0.058 | 0.106 | 0.071 | 0.036 | ||
| c4 | 0 | 0 | 0 | 0.002 | 0.012 | 0.032 | 0.024 | ||
| c5 | 0 | 0 | 0 | 0 | 0.002 | 0.003 | 0.005 | ||
| c6 | 0 | 0 | 0 | 0 | 0 | 0 | 0 | ||
See category definitions for details.
Statistical distribution
|
|
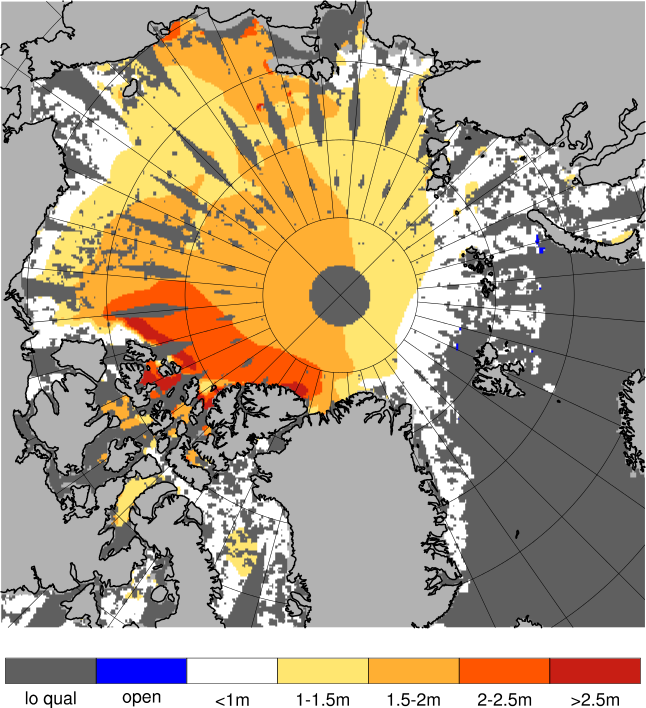
Sea ice thickness, day 7 forecast
Generated by /metno/routine/sms/V2/SIthickness/c2iceWebPage.sh Fri Apr 20 03:53:33 UTC 2018 on arcmfcval