Validation of ice thickness - Full domain
Bulletin date: 2018-03-29
Model: ARC MFC - TOPAZ
Data source: UCL CryoSAT-2 sea ice thickness
Validation statistics summary
| Bias (m) | RMS (m) | total grids | low SIT | OK SIT | high SIT | |
|---|---|---|---|---|---|---|
| Best estimate | -0.94 | 1.1 | 47492 | 19985 | 27480 | 27 |
| Day 1 forecast | -0.93 | 1.09 | 47492 | 19703 | 27760 | 29 |
| Day 4 forecast | -0.94 | 1.1 | 47492 | 19849 | 27614 | 29 |
| Day 7 forecast | -0.92 | 1.08 | 47492 | 19276 | 28188 | 28 |
| Day 10 forecast | -0.93 | 1.09 | 47492 | 19563 | 27898 | 31 |
Numbers in the three rightmost columns are grid counts. Regions with high/low sea ice thickness correspond to areas with model offsets from the gridded observations outside of one standard deviation. (Standard deviations are provided in the observational product.)
Definition of categories:
| Category | Sea ice thickness |
|---|---|
| c1 | <1m |
| c2 | 1 - 1.5m |
| c3 | 1.5 - 2m |
| c4 | 2 - 2.5m |
| c5 | 2.5 - 3m |
| c6 | >3m |
Best estimate vs. observations
Contingency table
| observations | |||||||||
|---|---|---|---|---|---|---|---|---|---|
| open | c1 | c2 | c3 | c4 | c5 | c6 | |||
| m o d e l |
open | 0 | 0 | 0 | 0 | 0 | 0 | 0 | |
| c1 | 0 | 0.004 | 0.059 | 0.175 | 0.086 | 0.029 | 0.011 | ||
| c2 | 0 | 0 | 0.014 | 0.133 | 0.123 | 0.038 | 0.006 | ||
| c3 | 0 | 0 | 0.004 | 0.059 | 0.09 | 0.059 | 0.032 | ||
| c4 | 0 | 0 | 0 | 0.002 | 0.01 | 0.032 | 0.023 | ||
| c5 | 0 | 0 | 0 | 0 | 0.002 | 0.003 | 0.006 | ||
| c6 | 0 | 0 | 0 | 0 | 0 | 0 | 0 | ||
See category definitions for details.
Statistical distribution
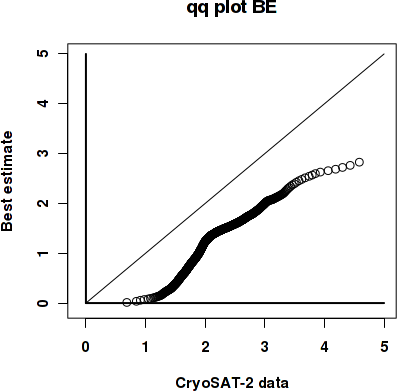
|
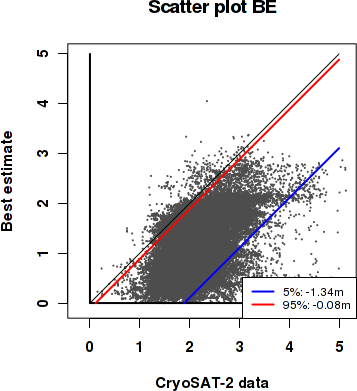
|
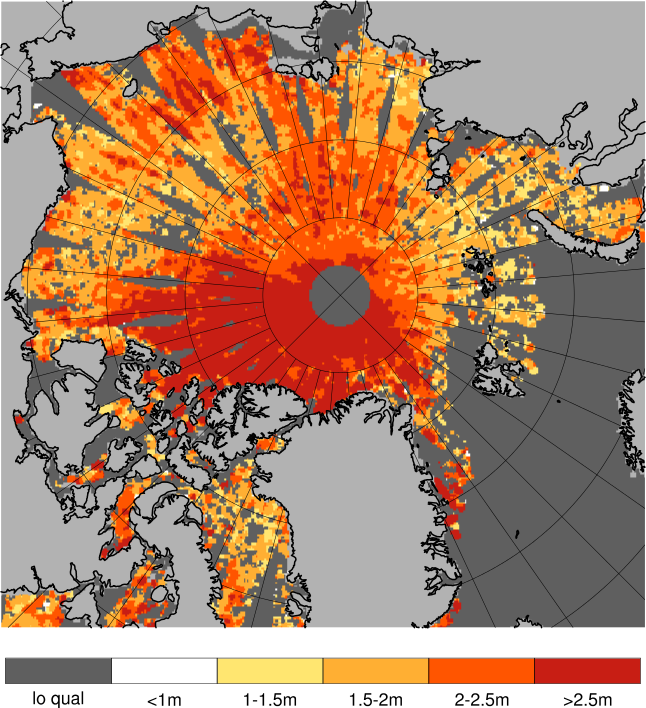
Observed sea ice thickness from CryoSAT
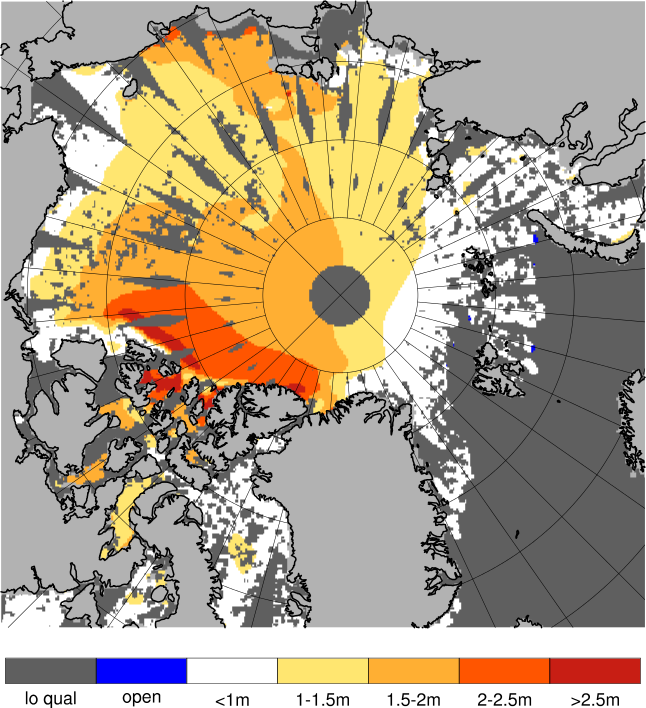
Sea ice thickness, best estimate product

Day 1 forecast vs. observations
Contingency table
| observations | |||||||||
|---|---|---|---|---|---|---|---|---|---|
| open | c1 | c2 | c3 | c4 | c5 | c6 | |||
| m o d e l |
open | 0 | 0 | 0 | 0.001 | 0 | 0 | 0 | |
| c1 | 0 | 0.004 | 0.058 | 0.172 | 0.084 | 0.028 | 0.011 | ||
| c2 | 0 | 0 | 0.015 | 0.138 | 0.127 | 0.039 | 0.006 | ||
| c3 | 0 | 0 | 0.004 | 0.057 | 0.088 | 0.059 | 0.032 | ||
| c4 | 0 | 0 | 0 | 0.001 | 0.009 | 0.031 | 0.022 | ||
| c5 | 0 | 0 | 0 | 0 | 0.001 | 0.004 | 0.006 | ||
| c6 | 0 | 0 | 0 | 0 | 0 | 0 | 0 | ||
See category definitions for details.
Statistical distribution

|

|
Sea ice thickness, day 1 forecast
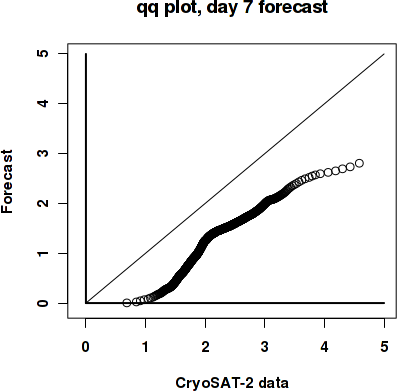
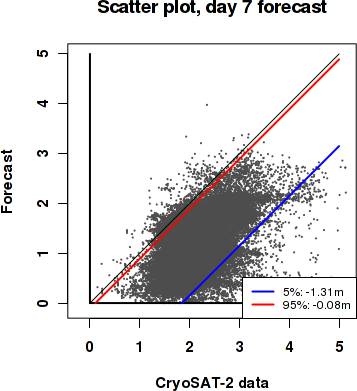
Day 7 forecast vs. observations
Contingency table
| observations | |||||||||
|---|---|---|---|---|---|---|---|---|---|
| open | c1 | c2 | c3 | c4 | c5 | c6 | |||
| m o d e l |
open | 0 | 0 | 0 | 0.001 | 0 | 0 | 0 | |
| c1 | 0 | 0.004 | 0.058 | 0.168 | 0.082 | 0.027 | 0.01 | ||
| c2 | 0 | 0 | 0.015 | 0.138 | 0.122 | 0.039 | 0.006 | ||
| c3 | 0 | 0 | 0.004 | 0.06 | 0.096 | 0.061 | 0.032 | ||
| c4 | 0 | 0 | 0 | 0.001 | 0.009 | 0.031 | 0.023 | ||
| c5 | 0 | 0 | 0 | 0 | 0.001 | 0.004 | 0.006 | ||
| c6 | 0 | 0 | 0 | 0 | 0 | 0 | 0 | ||
See category definitions for details.
Statistical distribution
|
|
Sea ice thickness, day 7 forecast

Generated by /metno/routine/sms/V2/SIthickness/c2iceWebPage.sh Fri Apr 13 03:53:42 UTC 2018 on arcmfcval