Validation of ice thickness - Full domain
Bulletin date: 2018-03-15
Model: ARC MFC - TOPAZ
Data source: UCL CryoSAT-2 sea ice thickness
Validation statistics summary
| Bias (m) | RMS (m) | total grids | low SIT | OK SIT | high SIT | |
|---|---|---|---|---|---|---|
| Best estimate | -0.96 | 1.12 | 46323 | 21117 | 25185 | 21 |
| Day 1 forecast | -0.95 | 1.12 | 46323 | 20903 | 25399 | 21 |
| Day 4 forecast | -0.96 | 1.12 | 46323 | 21040 | 25258 | 25 |
| Day 7 forecast | -0.94 | 1.1 | 46323 | 20321 | 25974 | 28 |
| Day 10 forecast | -0.94 | 1.09 | 46323 | 20372 | 25924 | 27 |
Numbers in the three rightmost columns are grid counts. Regions with high/low sea ice thickness correspond to areas with model offsets from the gridded observations outside of one standard deviation. (Standard deviations are provided in the observational product.)
Definition of categories:
| Category | Sea ice thickness |
|---|---|
| c1 | <1m |
| c2 | 1 - 1.5m |
| c3 | 1.5 - 2m |
| c4 | 2 - 2.5m |
| c5 | 2.5 - 3m |
| c6 | >3m |
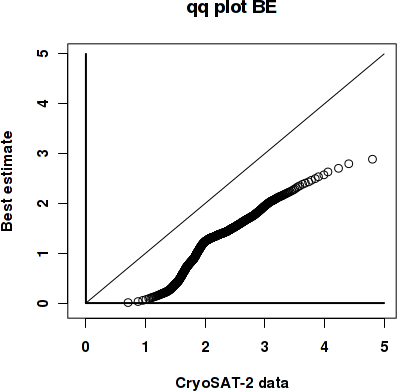
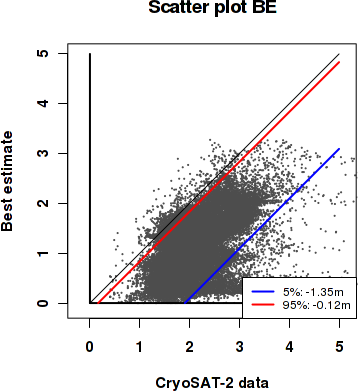
Best estimate vs. observations
Contingency table
| observations | |||||||||
|---|---|---|---|---|---|---|---|---|---|
| open | c1 | c2 | c3 | c4 | c5 | c6 | |||
| m o d e l |
open | 0 | 0 | 0 | 0.001 | 0 | 0 | 0 | |
| c1 | 0 | 0.004 | 0.072 | 0.178 | 0.072 | 0.028 | 0.015 | ||
| c2 | 0 | 0 | 0.02 | 0.175 | 0.159 | 0.031 | 0.005 | ||
| c3 | 0 | 0 | 0.003 | 0.031 | 0.055 | 0.054 | 0.029 | ||
| c4 | 0 | 0 | 0 | 0.001 | 0.007 | 0.026 | 0.025 | ||
| c5 | 0 | 0 | 0 | 0 | 0.001 | 0.003 | 0.004 | ||
| c6 | 0 | 0 | 0 | 0 | 0 | 0 | 0.001 | ||
See category definitions for details.
Statistical distribution
|
|
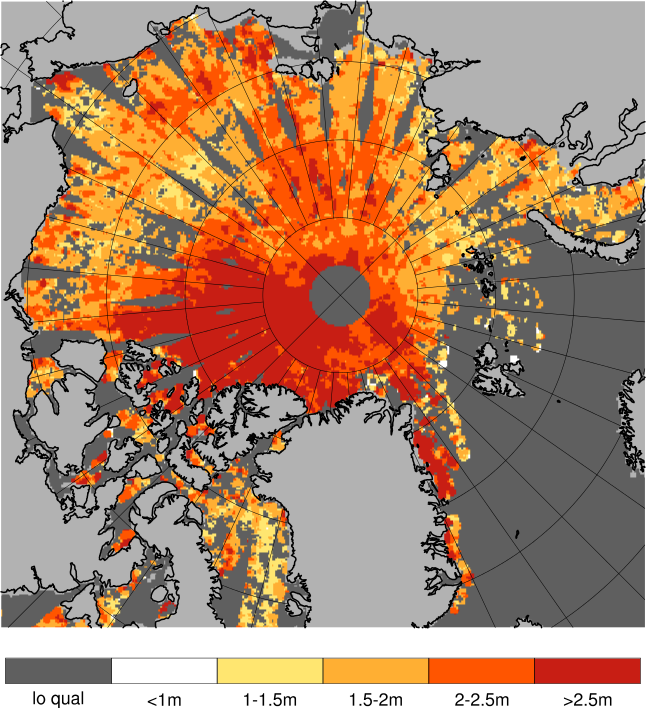
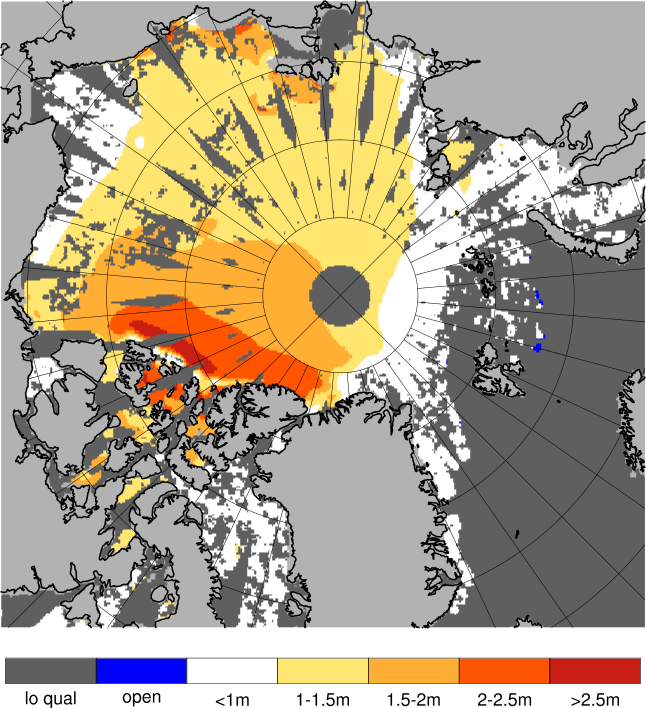
Observed sea ice thickness from CryoSAT
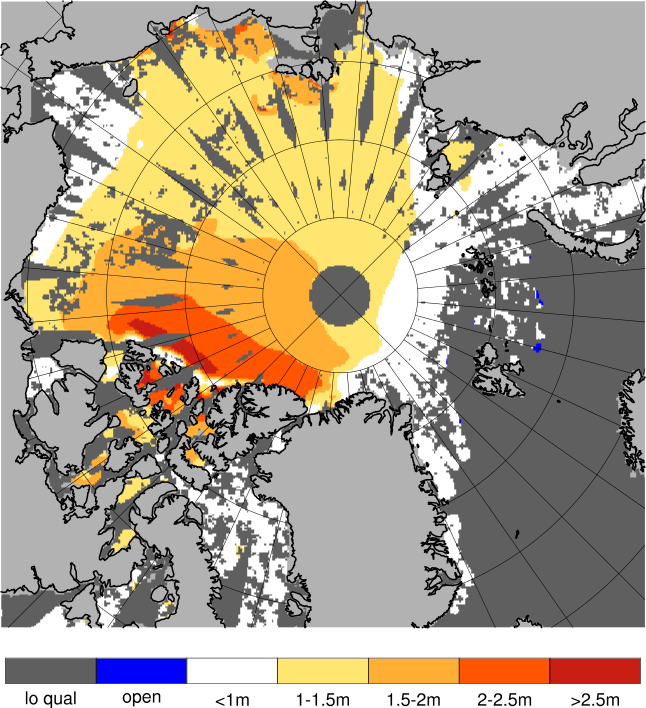
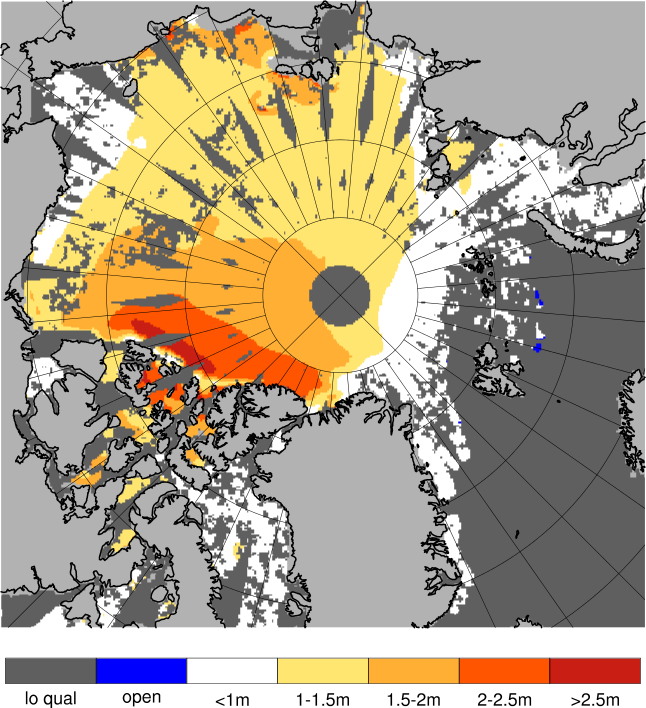
Sea ice thickness, best estimate product
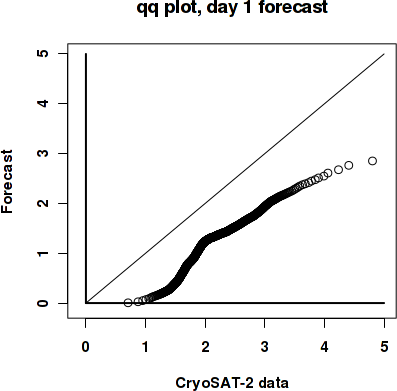
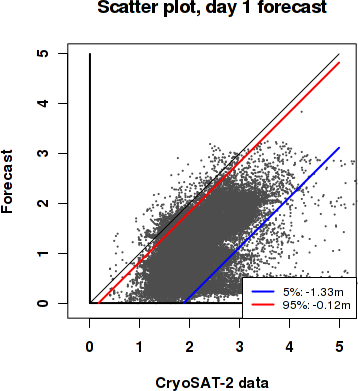
Day 1 forecast vs. observations
Contingency table
| observations | |||||||||
|---|---|---|---|---|---|---|---|---|---|
| open | c1 | c2 | c3 | c4 | c5 | c6 | |||
| m o d e l |
open | 0 | 0 | 0 | 0.001 | 0 | 0 | 0 | |
| c1 | 0 | 0.004 | 0.072 | 0.176 | 0.071 | 0.027 | 0.014 | ||
| c2 | 0 | 0 | 0.021 | 0.179 | 0.161 | 0.03 | 0.005 | ||
| c3 | 0 | 0 | 0.003 | 0.029 | 0.055 | 0.055 | 0.03 | ||
| c4 | 0 | 0 | 0 | 0.001 | 0.007 | 0.026 | 0.024 | ||
| c5 | 0 | 0 | 0 | 0 | 0 | 0.003 | 0.004 | ||
| c6 | 0 | 0 | 0 | 0 | 0 | 0 | 0.001 | ||
See category definitions for details.
Statistical distribution
|
|
Sea ice thickness, day 1 forecast
Day 7 forecast vs. observations
Contingency table
| observations | |||||||||
|---|---|---|---|---|---|---|---|---|---|
| open | c1 | c2 | c3 | c4 | c5 | c6 | |||
| m o d e l |
open | 0 | 0 | 0 | 0.001 | 0 | 0 | 0 | |
| c1 | 0 | 0.004 | 0.071 | 0.173 | 0.069 | 0.027 | 0.014 | ||
| c2 | 0 | 0 | 0.022 | 0.18 | 0.16 | 0.029 | 0.005 | ||
| c3 | 0 | 0 | 0.003 | 0.031 | 0.057 | 0.057 | 0.031 | ||
| c4 | 0 | 0 | 0 | 0.001 | 0.007 | 0.025 | 0.024 | ||
| c5 | 0 | 0 | 0 | 0 | 0 | 0.003 | 0.004 | ||
| c6 | 0 | 0 | 0 | 0 | 0 | 0 | 0.001 | ||
See category definitions for details.
Statistical distribution

|

|
Sea ice thickness, day 7 forecast
Generated by /metno/routine/sms/V2/SIthickness/c2iceWebPage.sh Fri Mar 30 03:53:43 UTC 2018 on arcmfcval