Validation of ice thickness - Full domain
Bulletin date: 2018-03-08
Model: ARC MFC - TOPAZ
Data source: UCL CryoSAT-2 sea ice thickness
Validation statistics summary
| Bias (m) | RMS (m) | total grids | low SIT | OK SIT | high SIT | |
|---|---|---|---|---|---|---|
| Best estimate | -0.97 | 1.13 | 45443 | 20930 | 24495 | 18 |
| Day 1 forecast | -0.96 | 1.11 | 45443 | 20559 | 24864 | 20 |
| Day 4 forecast | -0.96 | 1.11 | 45443 | 20631 | 24786 | 26 |
| Day 7 forecast | -0.95 | 1.1 | 45443 | 20020 | 25402 | 21 |
| Day 10 forecast | -0.95 | 1.09 | 45443 | 20225 | 25180 | 38 |
Numbers in the three rightmost columns are grid counts. Regions with high/low sea ice thickness correspond to areas with model offsets from the gridded observations outside of one standard deviation. (Standard deviations are provided in the observational product.)
Definition of categories:
| Category | Sea ice thickness |
|---|---|
| c1 | <1m |
| c2 | 1 - 1.5m |
| c3 | 1.5 - 2m |
| c4 | 2 - 2.5m |
| c5 | 2.5 - 3m |
| c6 | >3m |
Best estimate vs. observations
Contingency table
| observations | |||||||||
|---|---|---|---|---|---|---|---|---|---|
| open | c1 | c2 | c3 | c4 | c5 | c6 | |||
| m o d e l |
open | 0 | 0 | 0 | 0 | 0 | 0 | 0 | |
| c1 | 0 | 0.005 | 0.071 | 0.185 | 0.066 | 0.028 | 0.014 | ||
| c2 | 0 | 0 | 0.026 | 0.171 | 0.158 | 0.043 | 0.004 | ||
| c3 | 0 | 0 | 0.003 | 0.03 | 0.04 | 0.051 | 0.033 | ||
| c4 | 0 | 0 | 0 | 0.001 | 0.007 | 0.021 | 0.03 | ||
| c5 | 0 | 0 | 0 | 0 | 0.001 | 0.003 | 0.007 | ||
| c6 | 0 | 0 | 0 | 0 | 0 | 0 | 0.001 | ||
See category definitions for details.
Statistical distribution
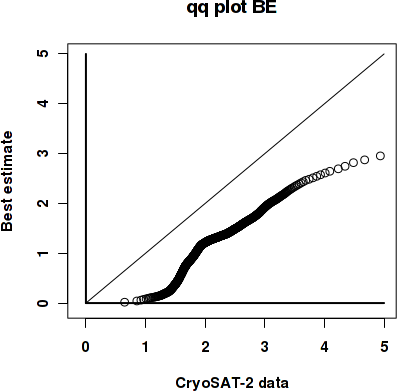
|
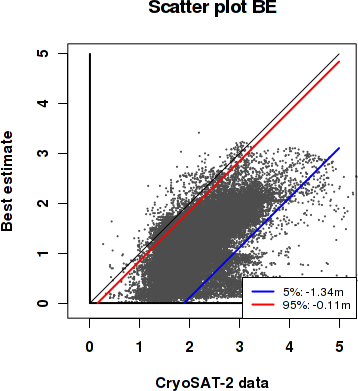
|
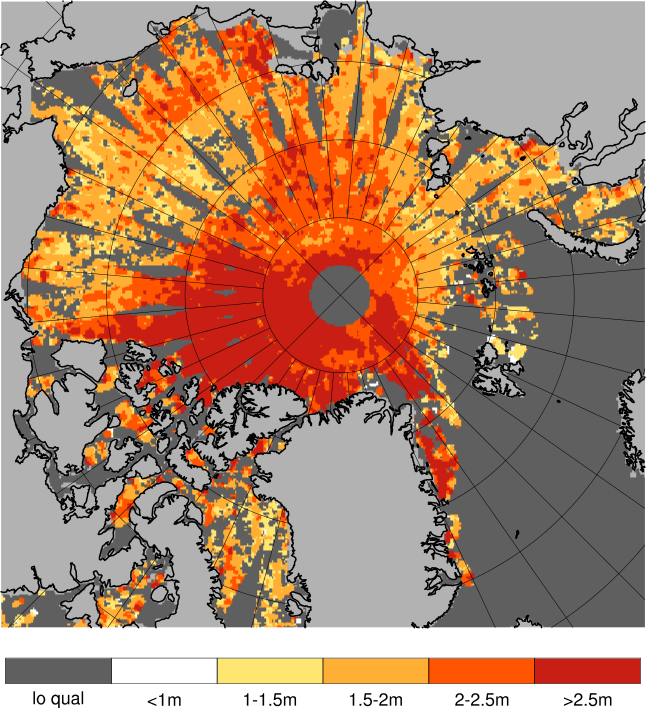
Observed sea ice thickness from CryoSAT
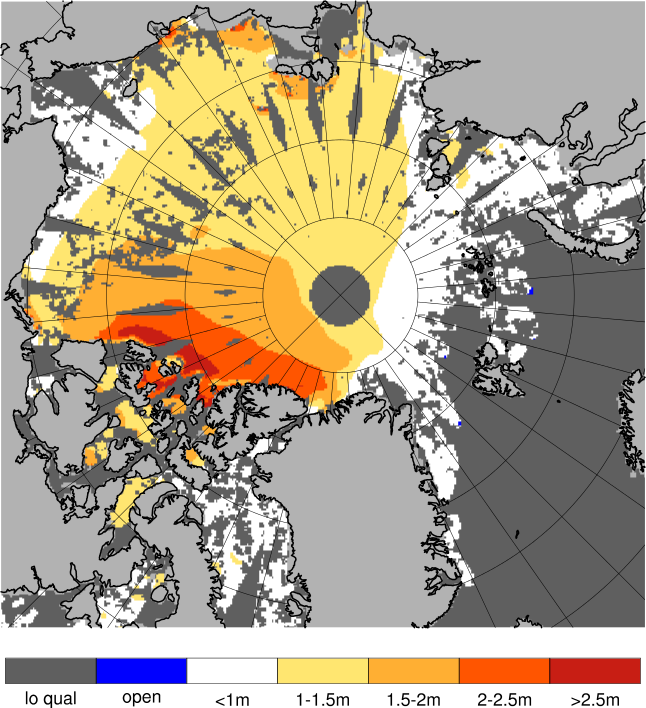
Sea ice thickness, best estimate product

Day 1 forecast vs. observations
Contingency table
| observations | |||||||||
|---|---|---|---|---|---|---|---|---|---|
| open | c1 | c2 | c3 | c4 | c5 | c6 | |||
| m o d e l |
open | 0 | 0 | 0 | 0 | 0 | 0 | 0 | |
| c1 | 0 | 0.005 | 0.071 | 0.183 | 0.064 | 0.027 | 0.013 | ||
| c2 | 0 | 0 | 0.027 | 0.175 | 0.161 | 0.044 | 0.004 | ||
| c3 | 0 | 0 | 0.002 | 0.028 | 0.039 | 0.051 | 0.033 | ||
| c4 | 0 | 0 | 0 | 0.001 | 0.007 | 0.021 | 0.029 | ||
| c5 | 0 | 0 | 0 | 0 | 0.001 | 0.003 | 0.007 | ||
| c6 | 0 | 0 | 0 | 0 | 0 | 0 | 0.001 | ||
See category definitions for details.
Statistical distribution

|

|
Sea ice thickness, day 1 forecast
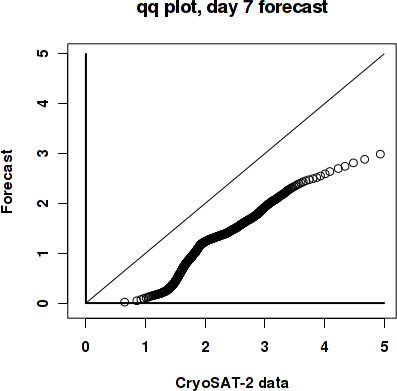
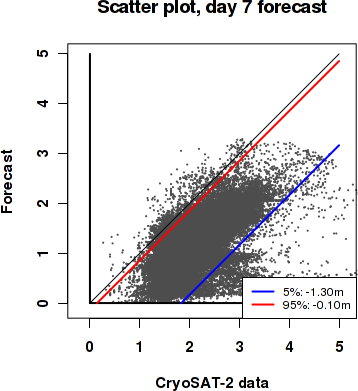
Day 7 forecast vs. observations
Contingency table
| observations | |||||||||
|---|---|---|---|---|---|---|---|---|---|
| open | c1 | c2 | c3 | c4 | c5 | c6 | |||
| m o d e l |
open | 0 | 0 | 0 | 0 | 0 | 0 | 0 | |
| c1 | 0 | 0.005 | 0.071 | 0.18 | 0.06 | 0.026 | 0.014 | ||
| c2 | 0 | 0 | 0.027 | 0.176 | 0.163 | 0.042 | 0.004 | ||
| c3 | 0 | 0 | 0.002 | 0.03 | 0.041 | 0.054 | 0.033 | ||
| c4 | 0 | 0 | 0 | 0.002 | 0.007 | 0.021 | 0.03 | ||
| c5 | 0 | 0 | 0 | 0 | 0.001 | 0.002 | 0.006 | ||
| c6 | 0 | 0 | 0 | 0 | 0 | 0 | 0.001 | ||
See category definitions for details.
Statistical distribution
|
|
Sea ice thickness, day 7 forecast

Generated by /metno/routine/sms/V2/SIthickness/c2iceWebPage.sh Fri Mar 23 03:53:53 UTC 2018 on arcmfcval