Validation of ice thickness - Full domain
Bulletin date: 2018-02-22
Model: ARC MFC - TOPAZ
Data source: UCL CryoSAT-2 sea ice thickness
Validation statistics summary
| Bias (m) | RMS (m) | total grids | low SIT | OK SIT | high SIT | |
|---|---|---|---|---|---|---|
| Best estimate | -0.9 | 1.08 | 43110 | 18272 | 24787 | 51 |
| Day 1 forecast | -0.9 | 1.08 | 43110 | 18037 | 25023 | 50 |
| Day 4 forecast | -0.9 | 1.08 | 43110 | 18178 | 24882 | 50 |
| Day 7 forecast | -0.89 | 1.07 | 43110 | 17714 | 25346 | 50 |
| Day 10 forecast | -0.9 | 1.08 | 43110 | 17943 | 25125 | 42 |
Numbers in the three rightmost columns are grid counts. Regions with high/low sea ice thickness correspond to areas with model offsets from the gridded observations outside of one standard deviation. (Standard deviations are provided in the observational product.)
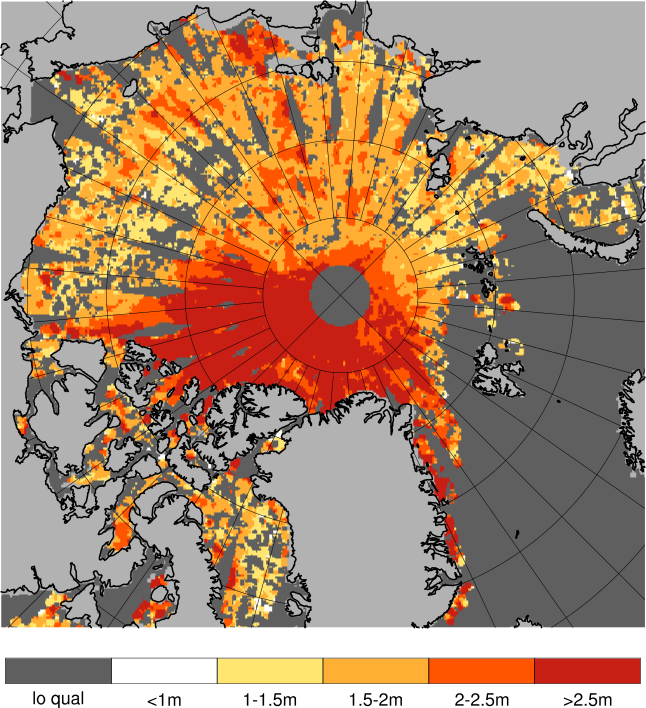
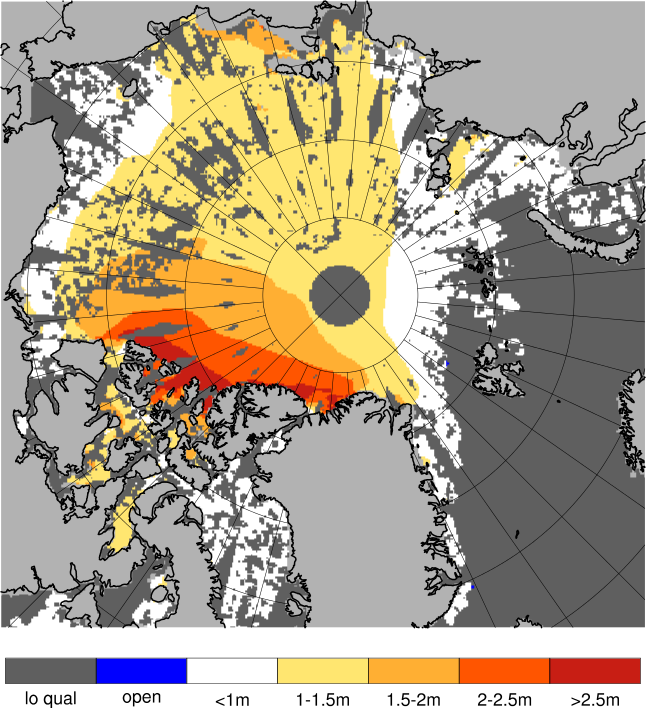
Definition of categories:
| Category | Sea ice thickness |
|---|---|
| c1 | <1m |
| c2 | 1 - 1.5m |
| c3 | 1.5 - 2m |
| c4 | 2 - 2.5m |
| c5 | 2.5 - 3m |
| c6 | >3m |
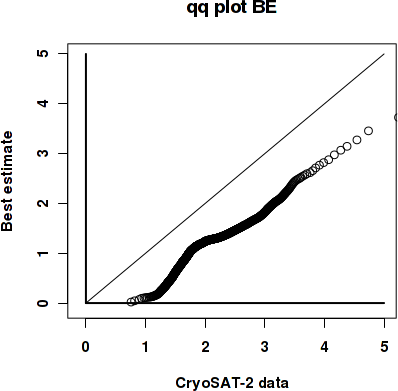
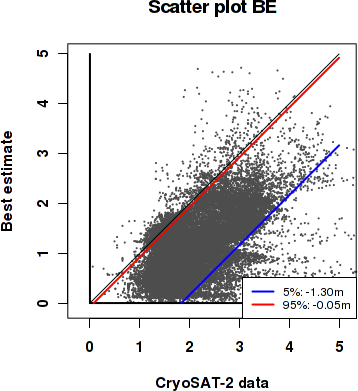
Best estimate vs. observations
Contingency table
| observations | |||||||||
|---|---|---|---|---|---|---|---|---|---|
| open | c1 | c2 | c3 | c4 | c5 | c6 | |||
| m o d e l |
open | 0 | 0 | 0 | 0 | 0 | 0 | 0 | |
| c1 | 0 | 0.006 | 0.108 | 0.168 | 0.053 | 0.023 | 0.013 | ||
| c2 | 0 | 0 | 0.052 | 0.223 | 0.101 | 0.037 | 0.012 | ||
| c3 | 0 | 0 | 0.005 | 0.025 | 0.021 | 0.032 | 0.045 | ||
| c4 | 0 | 0 | 0 | 0.002 | 0.011 | 0.018 | 0.026 | ||
| c5 | 0 | 0 | 0 | 0 | 0.002 | 0.003 | 0.008 | ||
| c6 | 0 | 0 | 0 | 0 | 0 | 0.002 | 0.004 | ||
See category definitions for details.
Statistical distribution
|
|
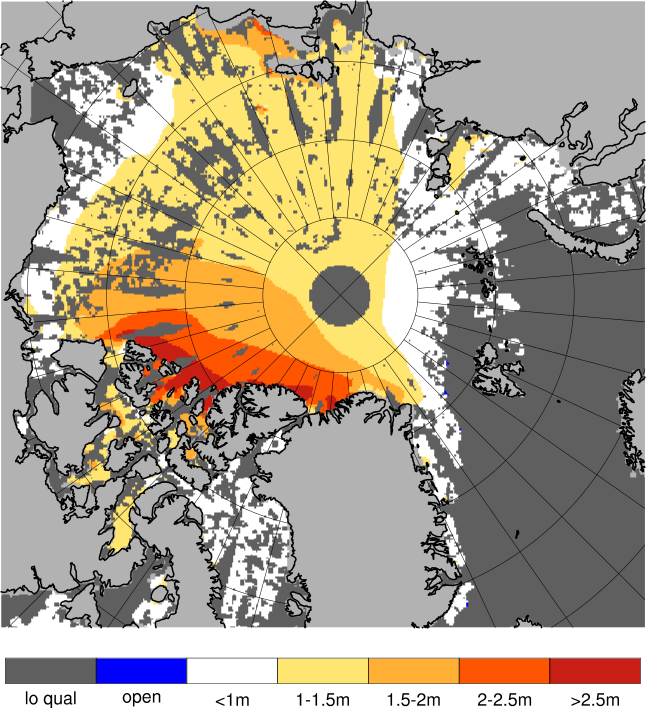
Observed sea ice thickness from CryoSAT
Sea ice thickness, best estimate product
Day 1 forecast vs. observations
Contingency table
| observations | |||||||||
|---|---|---|---|---|---|---|---|---|---|
| open | c1 | c2 | c3 | c4 | c5 | c6 | |||
| m o d e l |
open | 0 | 0 | 0 | 0 | 0 | 0 | 0 | |
| c1 | 0 | 0.006 | 0.108 | 0.167 | 0.052 | 0.023 | 0.013 | ||
| c2 | 0 | 0 | 0.052 | 0.224 | 0.102 | 0.036 | 0.011 | ||
| c3 | 0 | 0 | 0.004 | 0.023 | 0.022 | 0.033 | 0.047 | ||
| c4 | 0 | 0 | 0 | 0.002 | 0.011 | 0.018 | 0.024 | ||
| c5 | 0 | 0 | 0 | 0 | 0.002 | 0.003 | 0.008 | ||
| c6 | 0 | 0 | 0 | 0 | 0 | 0.002 | 0.004 | ||
See category definitions for details.
Statistical distribution
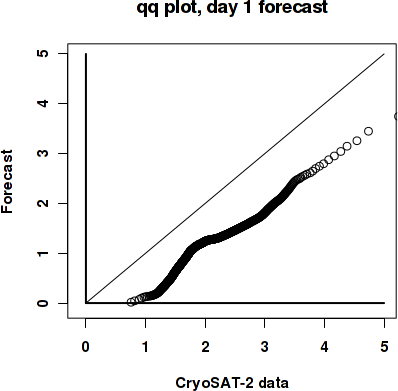
|
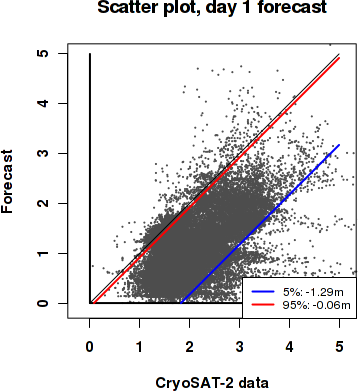
|
Sea ice thickness, day 1 forecast

Day 7 forecast vs. observations
Contingency table
| observations | |||||||||
|---|---|---|---|---|---|---|---|---|---|
| open | c1 | c2 | c3 | c4 | c5 | c6 | |||
| m o d e l |
open | 0 | 0 | 0 | 0.001 | 0 | 0 | 0 | |
| c1 | 0 | 0.006 | 0.107 | 0.166 | 0.053 | 0.023 | 0.013 | ||
| c2 | 0 | 0 | 0.053 | 0.223 | 0.099 | 0.034 | 0.012 | ||
| c3 | 0 | 0 | 0.005 | 0.026 | 0.022 | 0.034 | 0.047 | ||
| c4 | 0 | 0 | 0 | 0.002 | 0.012 | 0.018 | 0.025 | ||
| c5 | 0 | 0 | 0 | 0 | 0.002 | 0.003 | 0.007 | ||
| c6 | 0 | 0 | 0 | 0 | 0 | 0.002 | 0.004 | ||
See category definitions for details.
Statistical distribution
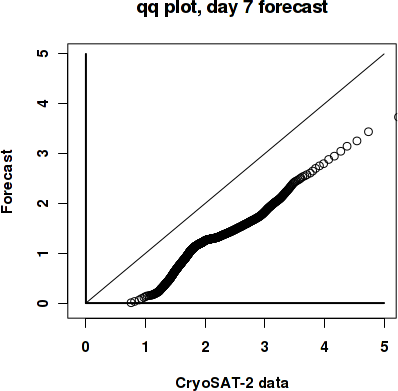
|
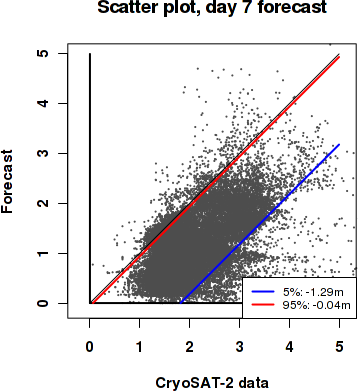
|
Sea ice thickness, day 7 forecast
Generated by /metno/routine/sms/V2/SIthickness/c2iceWebPage.sh Fri Mar 9 03:54:01 UTC 2018 on arcmfcval