Validation of ice thickness - Full domain
Bulletin date: 2017-11-23
Model: ARC MFC - TOPAZ
Data source: UCL CryoSAT-2 sea ice thickness
Validation statistics summary
| Bias (m) | RMS (m) | total grids | low SIT | OK SIT | high SIT | |
|---|---|---|---|---|---|---|
| Best estimate | -1.01 | 1.1 | 30071 | 20919 | 9115 | 37 |
| Day 1 forecast | -1.01 | 1.1 | 30071 | 20921 | 9111 | 39 |
| Day 4 forecast | -1.02 | 1.11 | 30071 | 21139 | 8893 | 39 |
| Day 7 forecast | -1 | 1.09 | 30071 | 20365 | 9666 | 40 |
| Day 10 forecast | -1.02 | 1.11 | 30071 | 21169 | 8865 | 37 |
Numbers in the three rightmost columns are grid counts. Regions with high/low sea ice thickness correspond to areas with model offsets from the gridded observations outside of one standard deviation. (Standard deviations are provided in the observational product.)
Definition of categories:
| Category | Sea ice thickness |
|---|---|
| c1 | <1m |
| c2 | 1 - 1.5m |
| c3 | 1.5 - 2m |
| c4 | 2 - 2.5m |
| c5 | 2.5 - 3m |
| c6 | >3m |
Best estimate vs. observations
Contingency table
| observations | |||||||||
|---|---|---|---|---|---|---|---|---|---|
| open | c1 | c2 | c3 | c4 | c5 | c6 | |||
| m o d e l |
open | 0 | 0 | 0 | 0 | 0 | 0 | 0 | |
| c1 | 0 | 0.057 | 0.248 | 0.298 | 0.107 | 0.012 | 0.004 | ||
| c2 | 0 | 0 | 0.01 | 0.045 | 0.06 | 0.029 | 0.001 | ||
| c3 | 0 | 0 | 0 | 0.006 | 0.025 | 0.051 | 0.02 | ||
| c4 | 0 | 0 | 0 | 0.001 | 0.007 | 0.008 | 0.007 | ||
| c5 | 0 | 0 | 0 | 0 | 0 | 0 | 0.001 | ||
| c6 | 0 | 0 | 0 | 0 | 0 | 0 | 0 | ||
See category definitions for details.
Statistical distribution
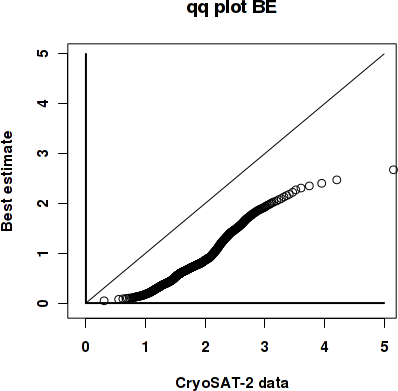
|
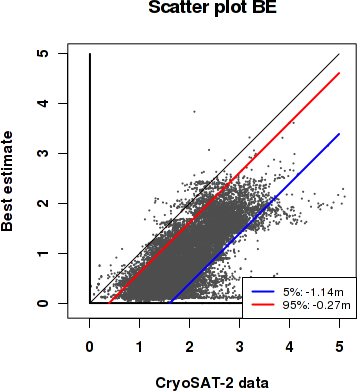
|
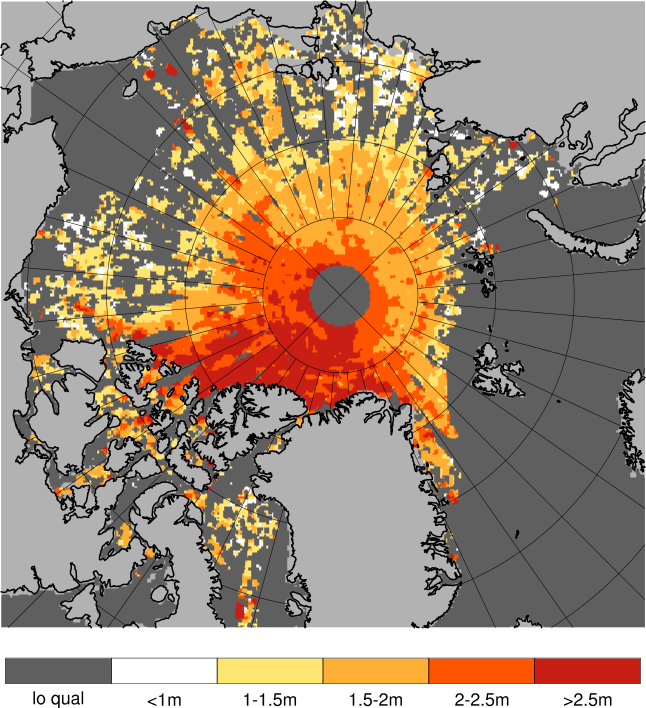
Observed sea ice thickness from CryoSAT
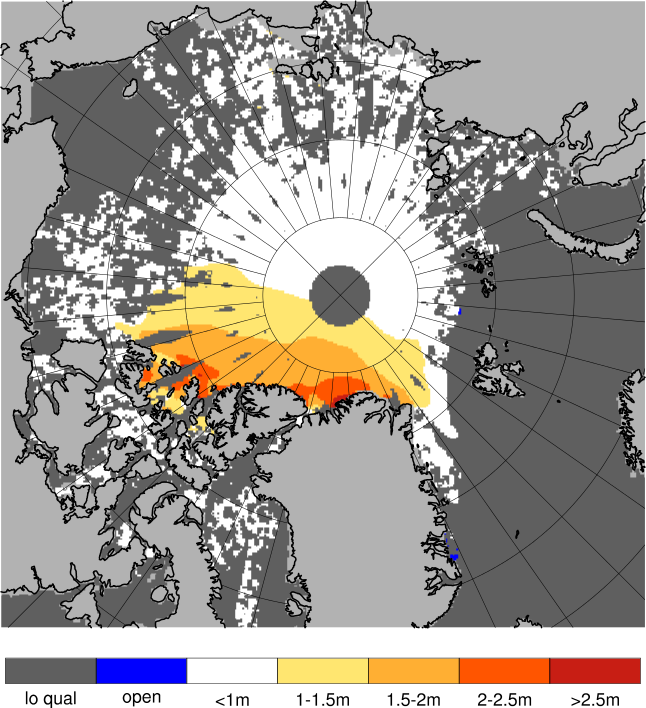
Sea ice thickness, best estimate product
Day 1 forecast vs. observations
Contingency table
| observations | |||||||||
|---|---|---|---|---|---|---|---|---|---|
| open | c1 | c2 | c3 | c4 | c5 | c6 | |||
| m o d e l |
open | 0 | 0 | 0 | 0 | 0 | 0 | 0 | |
| c1 | 0 | 0.057 | 0.249 | 0.298 | 0.108 | 0.012 | 0.004 | ||
| c2 | 0 | 0 | 0.009 | 0.046 | 0.059 | 0.03 | 0.002 | ||
| c3 | 0 | 0 | 0.001 | 0.005 | 0.026 | 0.05 | 0.02 | ||
| c4 | 0 | 0 | 0 | 0 | 0.006 | 0.008 | 0.007 | ||
| c5 | 0 | 0 | 0 | 0 | 0 | 0 | 0.001 | ||
| c6 | 0 | 0 | 0 | 0 | 0 | 0 | 0 | ||
See category definitions for details.
Statistical distribution
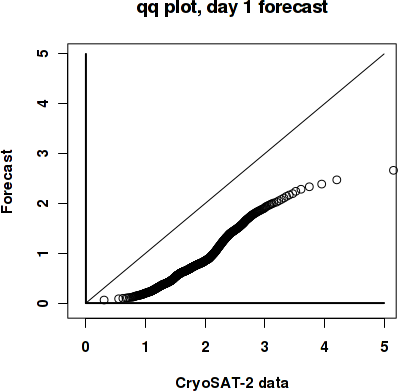
|
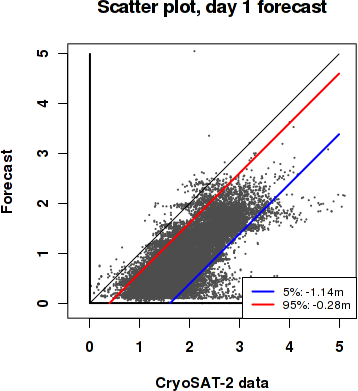
|
Sea ice thickness, day 1 forecast

Day 7 forecast vs. observations
Contingency table
| observations | |||||||||
|---|---|---|---|---|---|---|---|---|---|
| open | c1 | c2 | c3 | c4 | c5 | c6 | |||
| m o d e l |
open | 0 | 0 | 0 | 0 | 0 | 0 | 0 | |
| c1 | 0 | 0.056 | 0.247 | 0.296 | 0.106 | 0.012 | 0.004 | ||
| c2 | 0 | 0 | 0.011 | 0.046 | 0.06 | 0.029 | 0.003 | ||
| c3 | 0 | 0 | 0.001 | 0.006 | 0.026 | 0.052 | 0.02 | ||
| c4 | 0 | 0 | 0 | 0.001 | 0.006 | 0.007 | 0.007 | ||
| c5 | 0 | 0 | 0 | 0 | 0 | 0 | 0.001 | ||
| c6 | 0 | 0 | 0 | 0 | 0 | 0 | 0 | ||
See category definitions for details.
Statistical distribution

|
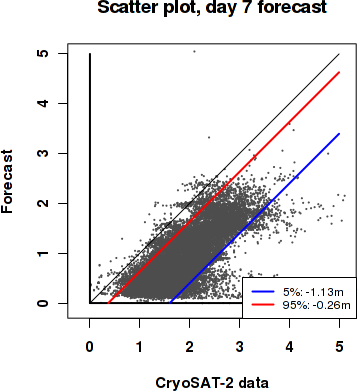
|
Sea ice thickness, day 7 forecast

Generated by /metno/routine/sms/V2/SIthickness/c2iceWebPage.sh Fri Dec 8 03:50:51 UTC 2017 on arcmfcval