Validation of ice thickness - Full domain
Bulletin date: 2017-11-16
Model: ARC MFC - TOPAZ
Data source: UCL CryoSAT-2 sea ice thickness
Validation statistics summary
| Bias (m) | RMS (m) | total grids | low SIT | OK SIT | high SIT | |
|---|---|---|---|---|---|---|
| Best estimate | -1.03 | 1.12 | 28526 | 20916 | 7599 | 11 |
| Day 1 forecast | -1.03 | 1.12 | 28526 | 20912 | 7603 | 11 |
| Day 4 forecast | -1.04 | 1.13 | 28526 | 21064 | 7453 | 9 |
| Day 7 forecast | -1.02 | 1.11 | 28526 | 20484 | 8021 | 21 |
| Day 10 forecast | -1.04 | 1.13 | 28526 | 20939 | 7568 | 19 |
Numbers in the three rightmost columns are grid counts. Regions with high/low sea ice thickness correspond to areas with model offsets from the gridded observations outside of one standard deviation. (Standard deviations are provided in the observational product.)
Definition of categories:
| Category | Sea ice thickness |
|---|---|
| c1 | <1m |
| c2 | 1 - 1.5m |
| c3 | 1.5 - 2m |
| c4 | 2 - 2.5m |
| c5 | 2.5 - 3m |
| c6 | >3m |
Best estimate vs. observations
Contingency table
| observations | |||||||||
|---|---|---|---|---|---|---|---|---|---|
| open | c1 | c2 | c3 | c4 | c5 | c6 | |||
| m o d e l |
open | 0 | 0 | 0 | 0 | 0 | 0 | 0 | |
| c1 | 0 | 0.05 | 0.246 | 0.294 | 0.12 | 0.013 | 0.002 | ||
| c2 | 0 | 0 | 0.008 | 0.039 | 0.066 | 0.036 | 0.001 | ||
| c3 | 0 | 0 | 0.001 | 0.007 | 0.025 | 0.049 | 0.015 | ||
| c4 | 0 | 0 | 0 | 0.002 | 0.005 | 0.012 | 0.008 | ||
| c5 | 0 | 0 | 0 | 0 | 0.001 | 0 | 0.002 | ||
| c6 | 0 | 0 | 0 | 0 | 0 | 0 | 0 | ||
See category definitions for details.
Statistical distribution
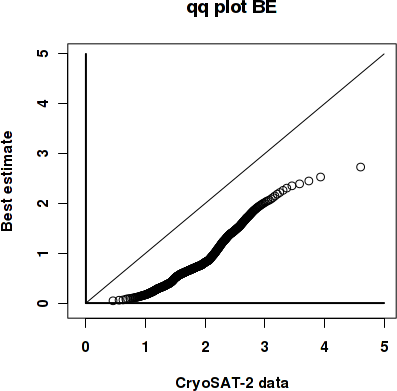
|

|
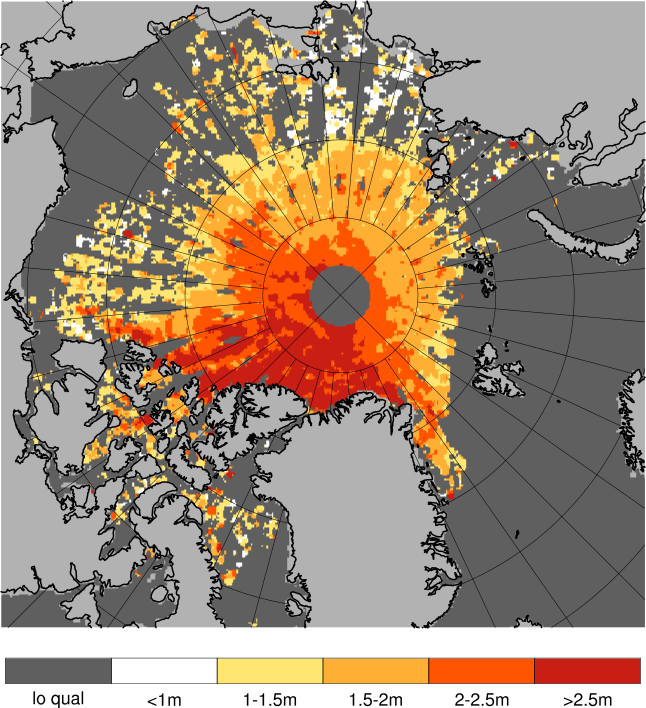
Observed sea ice thickness from CryoSAT
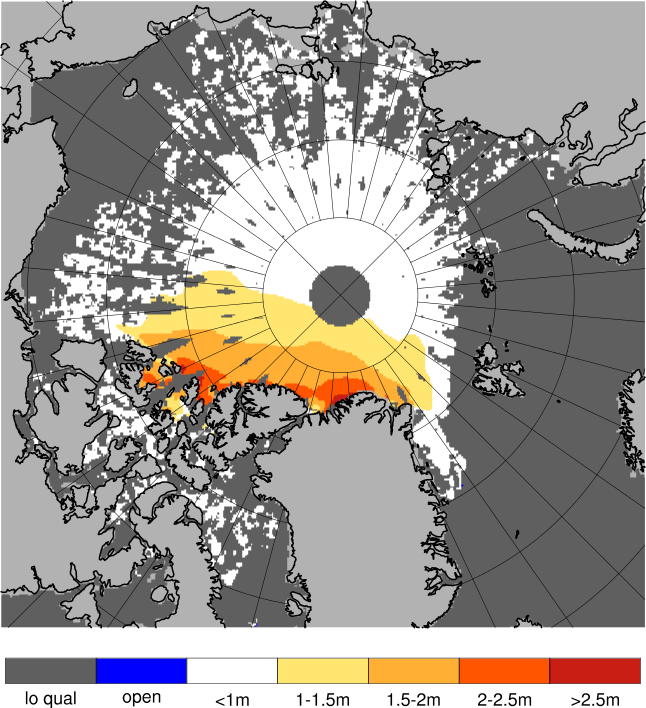
Sea ice thickness, best estimate product
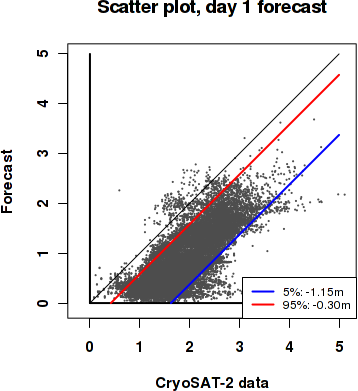
Day 1 forecast vs. observations
Contingency table
| observations | |||||||||
|---|---|---|---|---|---|---|---|---|---|
| open | c1 | c2 | c3 | c4 | c5 | c6 | |||
| m o d e l |
open | 0 | 0 | 0 | 0 | 0 | 0 | 0 | |
| c1 | 0 | 0.05 | 0.246 | 0.295 | 0.121 | 0.014 | 0.002 | ||
| c2 | 0 | 0 | 0.007 | 0.038 | 0.065 | 0.038 | 0.001 | ||
| c3 | 0 | 0 | 0.001 | 0.007 | 0.025 | 0.048 | 0.015 | ||
| c4 | 0 | 0 | 0 | 0.002 | 0.005 | 0.011 | 0.007 | ||
| c5 | 0 | 0 | 0 | 0 | 0 | 0 | 0.002 | ||
| c6 | 0 | 0 | 0 | 0 | 0 | 0 | 0 | ||
See category definitions for details.
Statistical distribution
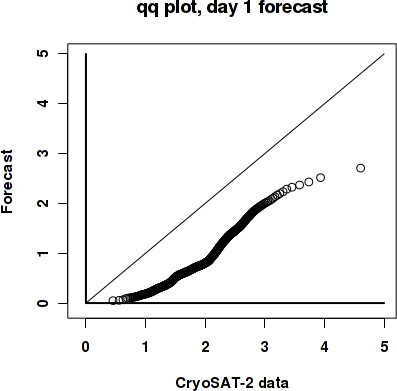
|
|
Sea ice thickness, day 1 forecast

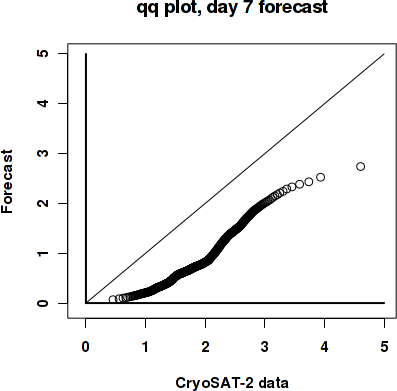
Day 7 forecast vs. observations
Contingency table
| observations | |||||||||
|---|---|---|---|---|---|---|---|---|---|
| open | c1 | c2 | c3 | c4 | c5 | c6 | |||
| m o d e l |
open | 0 | 0 | 0 | 0 | 0 | 0 | 0 | |
| c1 | 0 | 0.05 | 0.244 | 0.294 | 0.12 | 0.013 | 0.002 | ||
| c2 | 0 | 0 | 0.009 | 0.04 | 0.066 | 0.036 | 0.001 | ||
| c3 | 0 | 0 | 0.001 | 0.007 | 0.024 | 0.05 | 0.016 | ||
| c4 | 0 | 0 | 0 | 0.002 | 0.005 | 0.011 | 0.007 | ||
| c5 | 0 | 0 | 0 | 0 | 0.001 | 0 | 0.002 | ||
| c6 | 0 | 0 | 0 | 0 | 0 | 0 | 0 | ||
See category definitions for details.
Statistical distribution
|

|
Sea ice thickness, day 7 forecast

Generated by /metno/routine/sms/V2/SIthickness/c2iceWebPage.sh Fri Dec 1 03:52:06 UTC 2017 on arcmfcval