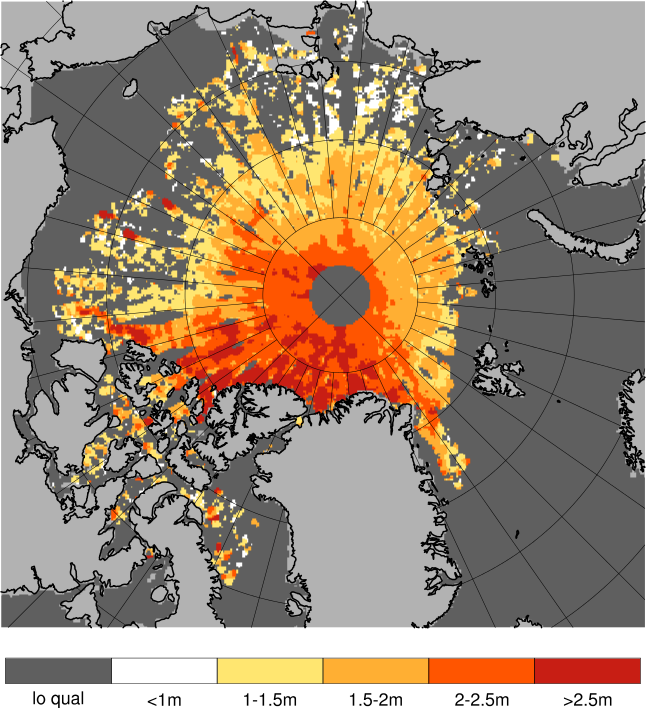
Validation of ice thickness - Full domain
Bulletin date: 2017-11-09
Model: ARC MFC - TOPAZ
Data source: UCL CryoSAT-2 sea ice thickness
Validation statistics summary
| Bias (m) | RMS (m) | total grids | low SIT | OK SIT | high SIT | |
|---|---|---|---|---|---|---|
| Best estimate | -0.99 | 1.11 | 27504 | 19643 | 7834 | 27 |
| Day 1 forecast | -1 | 1.12 | 27504 | 19691 | 7793 | 20 |
| Day 4 forecast | -1 | 1.12 | 27504 | 19829 | 7656 | 19 |
| Day 7 forecast | -0.98 | 1.1 | 27504 | 19259 | 8220 | 25 |
| Day 10 forecast | -1 | 1.12 | 27504 | 19781 | 7700 | 23 |
Numbers in the three rightmost columns are grid counts. Regions with high/low sea ice thickness correspond to areas with model offsets from the gridded observations outside of one standard deviation. (Standard deviations are provided in the observational product.)
Definition of categories:
| Category | Sea ice thickness |
|---|---|
| c1 | <1m |
| c2 | 1 - 1.5m |
| c3 | 1.5 - 2m |
| c4 | 2 - 2.5m |
| c5 | 2.5 - 3m |
| c6 | >3m |
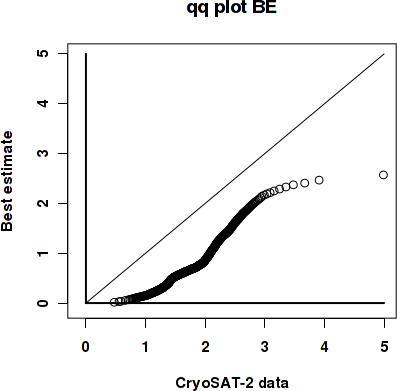
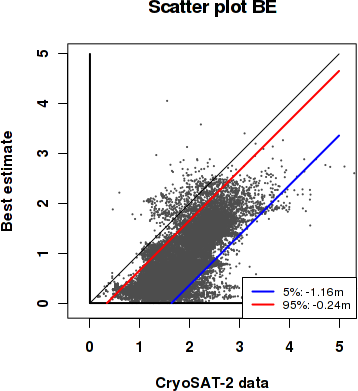
Best estimate vs. observations
Contingency table
| observations | |||||||||
|---|---|---|---|---|---|---|---|---|---|
| open | c1 | c2 | c3 | c4 | c5 | c6 | |||
| m o d e l |
open | 0 | 0 | 0.001 | 0 | 0 | 0 | 0 | |
| c1 | 0 | 0.05 | 0.274 | 0.283 | 0.098 | 0.01 | 0.004 | ||
| c2 | 0 | 0 | 0.013 | 0.041 | 0.076 | 0.026 | 0 | ||
| c3 | 0 | 0 | 0.002 | 0.011 | 0.041 | 0.031 | 0.007 | ||
| c4 | 0 | 0 | 0.001 | 0.003 | 0.008 | 0.011 | 0.005 | ||
| c5 | 0 | 0 | 0 | 0 | 0.001 | 0 | 0.001 | ||
| c6 | 0 | 0 | 0 | 0 | 0 | 0 | 0 | ||
See category definitions for details.
Statistical distribution
|
|
Observed sea ice thickness from CryoSAT
Sea ice thickness, best estimate product

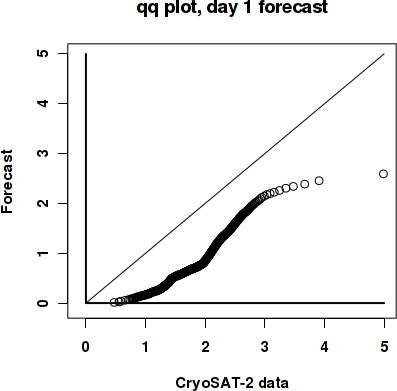
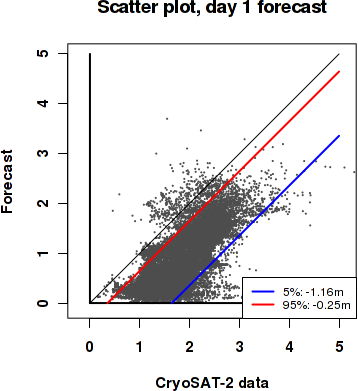
Day 1 forecast vs. observations
Contingency table
| observations | |||||||||
|---|---|---|---|---|---|---|---|---|---|
| open | c1 | c2 | c3 | c4 | c5 | c6 | |||
| m o d e l |
open | 0 | 0 | 0.001 | 0 | 0 | 0 | 0 | |
| c1 | 0 | 0.05 | 0.275 | 0.285 | 0.098 | 0.01 | 0.004 | ||
| c2 | 0 | 0 | 0.012 | 0.04 | 0.078 | 0.025 | 0 | ||
| c3 | 0 | 0 | 0.002 | 0.01 | 0.039 | 0.032 | 0.007 | ||
| c4 | 0 | 0 | 0.001 | 0.003 | 0.008 | 0.01 | 0.005 | ||
| c5 | 0 | 0 | 0 | 0 | 0.001 | 0 | 0.001 | ||
| c6 | 0 | 0 | 0 | 0 | 0 | 0 | 0 | ||
See category definitions for details.
Statistical distribution
|
|
Sea ice thickness, day 1 forecast

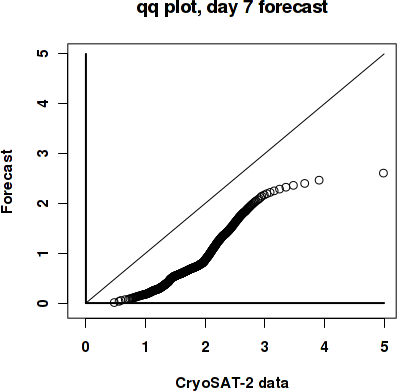
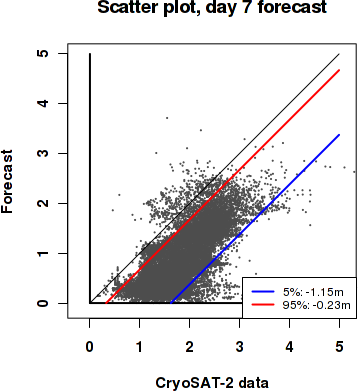
Day 7 forecast vs. observations
Contingency table
| observations | |||||||||
|---|---|---|---|---|---|---|---|---|---|
| open | c1 | c2 | c3 | c4 | c5 | c6 | |||
| m o d e l |
open | 0 | 0 | 0.001 | 0.001 | 0 | 0 | 0 | |
| c1 | 0 | 0.05 | 0.272 | 0.284 | 0.098 | 0.01 | 0.004 | ||
| c2 | 0 | 0 | 0.015 | 0.041 | 0.076 | 0.023 | 0 | ||
| c3 | 0 | 0 | 0.002 | 0.01 | 0.041 | 0.033 | 0.007 | ||
| c4 | 0 | 0 | 0.001 | 0.003 | 0.009 | 0.011 | 0.005 | ||
| c5 | 0 | 0 | 0 | 0 | 0.001 | 0.001 | 0.001 | ||
| c6 | 0 | 0 | 0 | 0 | 0 | 0 | 0 | ||
See category definitions for details.
Statistical distribution
|
|
Sea ice thickness, day 7 forecast

Generated by /metno/routine/sms/V2/SIthickness/c2iceWebPage.sh Fri Nov 24 03:52:57 UTC 2017 on arcmfcval