Validation of ice thickness - Full domain
Bulletin date: 2017-10-26
Model: ARC MFC - TOPAZ
Data source: UCL CryoSAT-2 sea ice thickness
Validation statistics summary
| Bias (m) | RMS (m) | total grids | low SIT | OK SIT | high SIT | |
|---|---|---|---|---|---|---|
| Best estimate | -0.86 | 0.95 | 22963 | 13713 | 9220 | 30 |
| Day 1 forecast | -0.85 | 0.95 | 22963 | 13500 | 9437 | 26 |
| Day 4 forecast | -0.85 | 0.95 | 22963 | 13511 | 9429 | 23 |
| Day 7 forecast | -0.84 | 0.94 | 22963 | 13121 | 9809 | 33 |
| Day 10 forecast | -0.84 | 0.94 | 22963 | 12933 | 9997 | 33 |
Numbers in the three rightmost columns are grid counts. Regions with high/low sea ice thickness correspond to areas with model offsets from the gridded observations outside of one standard deviation. (Standard deviations are provided in the observational product.)
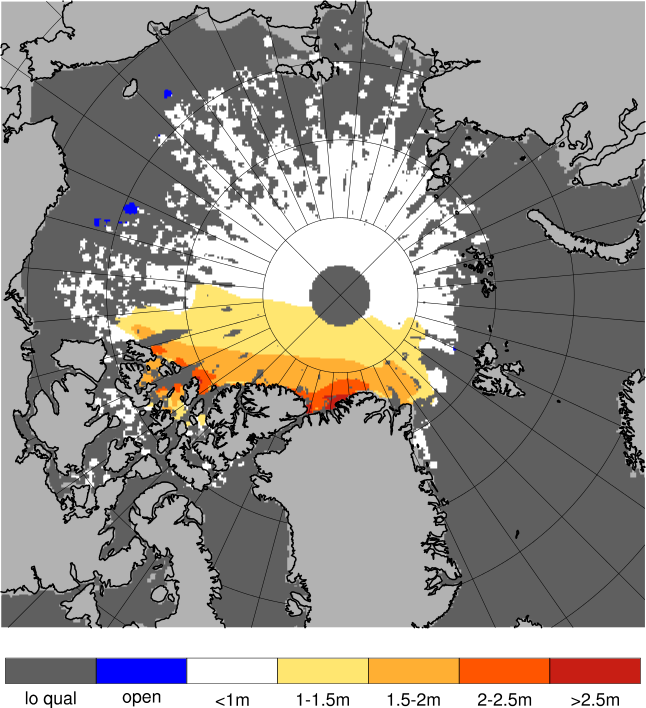
Definition of categories:
| Category | Sea ice thickness |
|---|---|
| c1 | <1m |
| c2 | 1 - 1.5m |
| c3 | 1.5 - 2m |
| c4 | 2 - 2.5m |
| c5 | 2.5 - 3m |
| c6 | >3m |
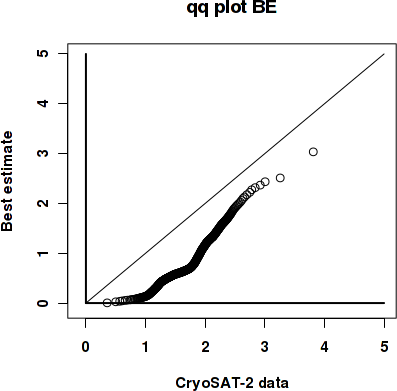
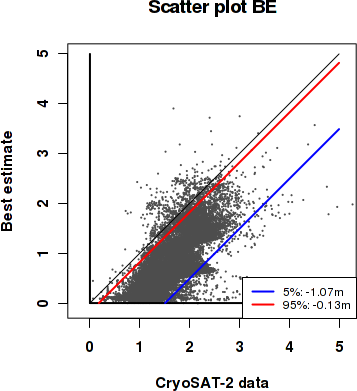
Best estimate vs. observations
Contingency table
| observations | |||||||||
|---|---|---|---|---|---|---|---|---|---|
| open | c1 | c2 | c3 | c4 | c5 | c6 | |||
| m o d e l |
open | 0 | 0.001 | 0.001 | 0 | 0 | 0 | 0 | |
| c1 | 0 | 0.059 | 0.299 | 0.243 | 0.077 | 0.002 | 0.001 | ||
| c2 | 0 | 0 | 0.019 | 0.081 | 0.079 | 0.006 | 0.001 | ||
| c3 | 0 | 0 | 0.004 | 0.026 | 0.059 | 0.014 | 0.002 | ||
| c4 | 0 | 0 | 0.001 | 0.004 | 0.01 | 0.007 | 0.001 | ||
| c5 | 0 | 0 | 0 | 0 | 0.001 | 0.001 | 0 | ||
| c6 | 0 | 0 | 0 | 0 | 0 | 0 | 0 | ||
See category definitions for details.
Statistical distribution
|
|
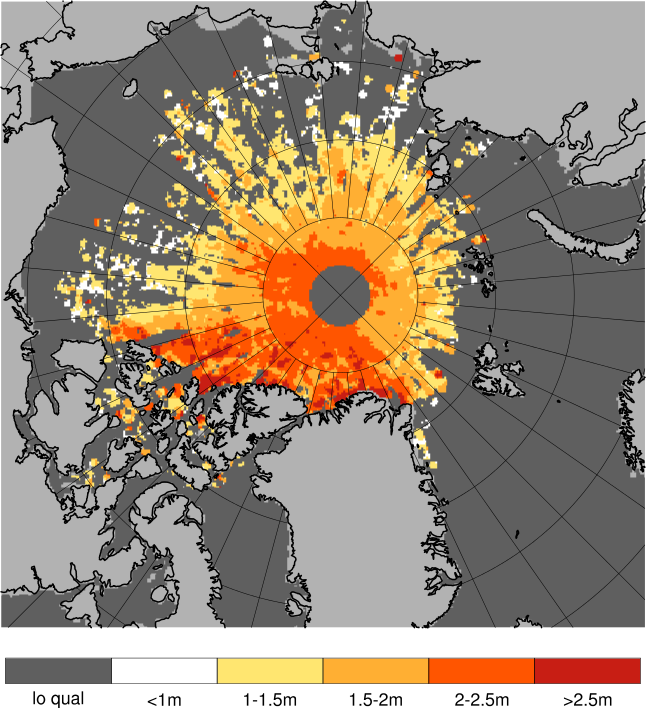
Observed sea ice thickness from CryoSAT
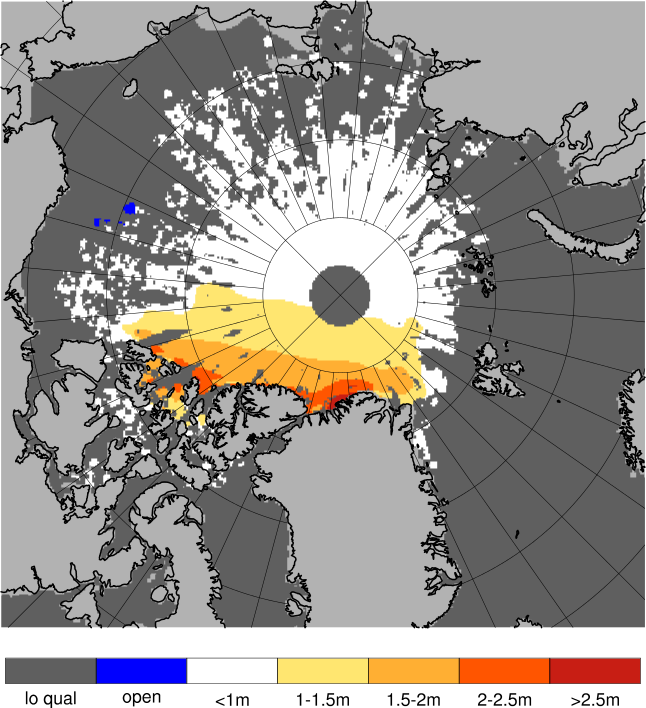
Sea ice thickness, best estimate product
Day 1 forecast vs. observations
Contingency table
| observations | |||||||||
|---|---|---|---|---|---|---|---|---|---|
| open | c1 | c2 | c3 | c4 | c5 | c6 | |||
| m o d e l |
open | 0 | 0.001 | 0.002 | 0 | 0 | 0 | 0 | |
| c1 | 0 | 0.059 | 0.297 | 0.243 | 0.078 | 0.002 | 0.001 | ||
| c2 | 0 | 0 | 0.019 | 0.079 | 0.082 | 0.008 | 0.001 | ||
| c3 | 0 | 0 | 0.005 | 0.028 | 0.056 | 0.012 | 0.002 | ||
| c4 | 0 | 0 | 0.001 | 0.004 | 0.01 | 0.007 | 0.001 | ||
| c5 | 0 | 0 | 0 | 0.001 | 0.001 | 0.001 | 0 | ||
| c6 | 0 | 0 | 0 | 0 | 0 | 0 | 0 | ||
See category definitions for details.
Statistical distribution
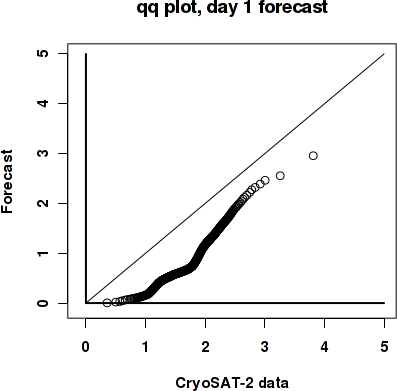
|
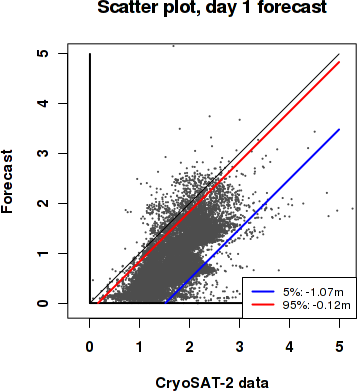
|
Sea ice thickness, day 1 forecast

Day 7 forecast vs. observations
Contingency table
| observations | |||||||||
|---|---|---|---|---|---|---|---|---|---|
| open | c1 | c2 | c3 | c4 | c5 | c6 | |||
| m o d e l |
open | 0 | 0.001 | 0.002 | 0 | 0 | 0 | 0 | |
| c1 | 0 | 0.058 | 0.292 | 0.242 | 0.077 | 0.002 | 0.001 | ||
| c2 | 0 | 0 | 0.023 | 0.08 | 0.081 | 0.008 | 0.001 | ||
| c3 | 0 | 0 | 0.005 | 0.028 | 0.057 | 0.012 | 0.003 | ||
| c4 | 0 | 0 | 0.001 | 0.004 | 0.009 | 0.007 | 0.001 | ||
| c5 | 0 | 0 | 0 | 0.001 | 0.001 | 0.001 | 0 | ||
| c6 | 0 | 0 | 0 | 0 | 0 | 0 | 0 | ||
See category definitions for details.
Statistical distribution

|
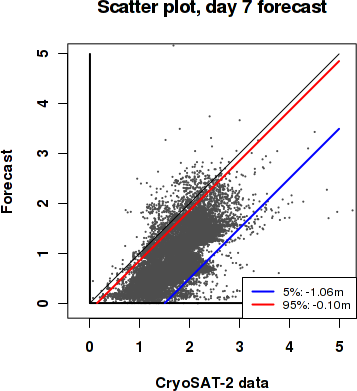
|
Sea ice thickness, day 7 forecast
Generated by /metno/routine/sms/V2/SIthickness/c2iceWebPage.sh Fri Nov 10 03:53:19 UTC 2017 on arcmfcval