Validation of ice thickness - Full domain
Bulletin date: 2017-05-18
Model: ARC MFC - TOPAZ
Data source: UCL CryoSAT-2 sea ice thickness
Validation statistics summary
| Bias (m) | RMS (m) | total grids | low SIT | OK SIT | high SIT | |
|---|---|---|---|---|---|---|
| Best estimate | -0.71 | 0.89 | 37895 | 10407 | 27268 | 220 |
| Day 1 forecast | -0.71 | 0.89 | 37895 | 10421 | 27251 | 223 |
| Day 4 forecast | -0.71 | 0.89 | 37895 | 10512 | 27152 | 231 |
| Day 7 forecast | -0.7 | 0.88 | 37895 | 10223 | 27449 | 223 |
| Day 10 forecast | -0.71 | 0.89 | 37895 | 10442 | 27218 | 235 |
Numbers in the three rightmost columns are grid counts. Regions with high/low sea ice thickness correspond to areas with model offsets from the gridded observations outside of one standard deviation. (Standard deviations are provided in the observational product.)
Definition of categories:
| Category | Sea ice thickness |
|---|---|
| c1 | <1m |
| c2 | 1 - 1.5m |
| c3 | 1.5 - 2m |
| c4 | 2 - 2.5m |
| c5 | 2.5 - 3m |
| c6 | >3m |
Best estimate vs. observations
Contingency table
| observations | |||||||||
|---|---|---|---|---|---|---|---|---|---|
| open | c1 | c2 | c3 | c4 | c5 | c6 | |||
| m o d e l |
open | 0 | 0 | 0 | 0 | 0 | 0 | 0 | |
| c1 | 0 | 0.003 | 0.036 | 0.066 | 0.016 | 0.006 | 0.003 | ||
| c2 | 0 | 0.003 | 0.025 | 0.128 | 0.165 | 0.061 | 0.009 | ||
| c3 | 0 | 0 | 0.005 | 0.053 | 0.115 | 0.086 | 0.019 | ||
| c4 | 0 | 0 | 0.002 | 0.005 | 0.042 | 0.059 | 0.009 | ||
| c5 | 0 | 0 | 0 | 0.001 | 0.008 | 0.029 | 0.019 | ||
| c6 | 0 | 0 | 0 | 0 | 0.001 | 0.004 | 0.021 | ||
See category definitions for details.
Statistical distribution
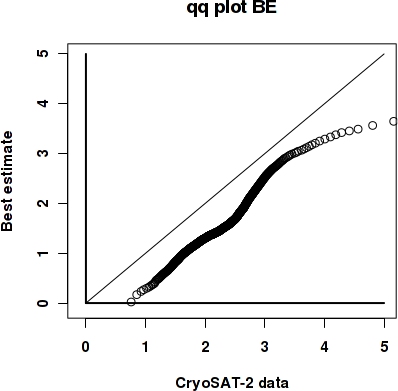
|
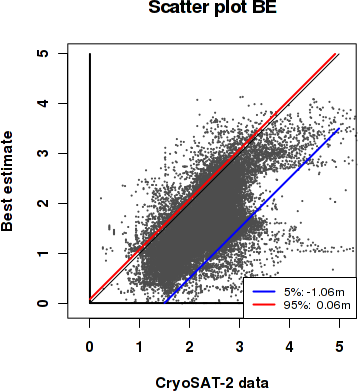
|
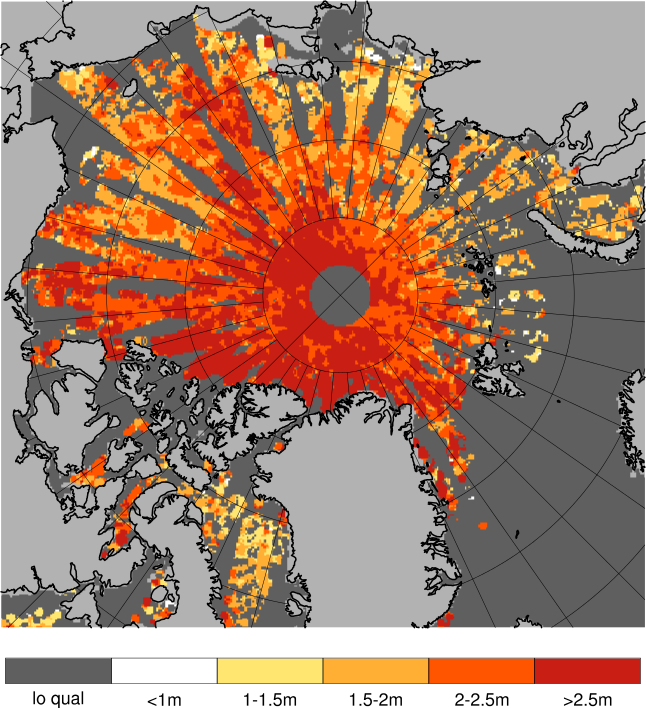
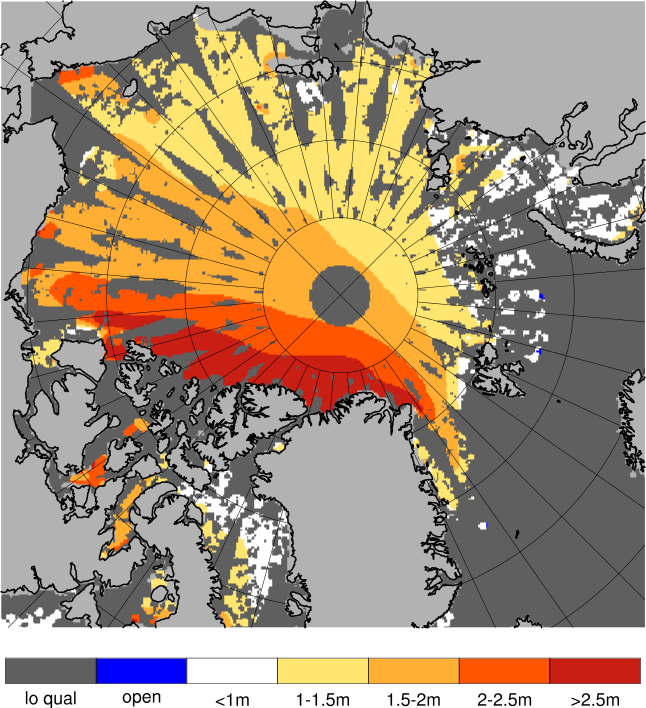
Observed sea ice thickness from CryoSAT
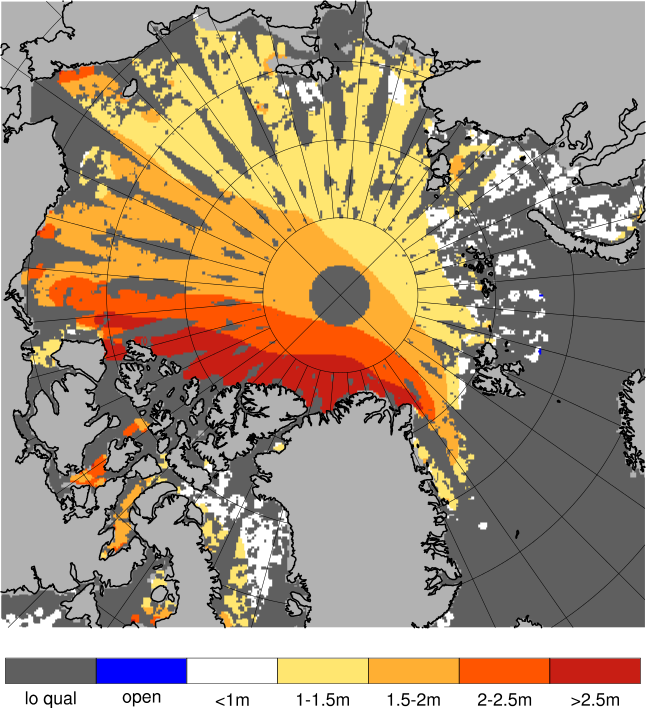
Sea ice thickness, best estimate product
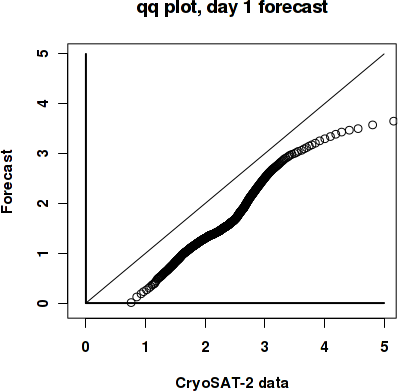
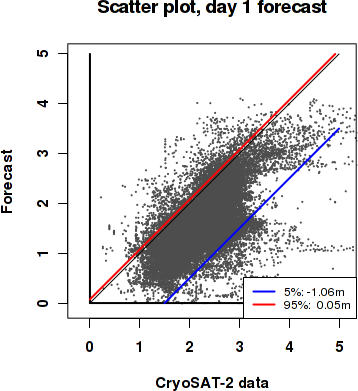
Day 1 forecast vs. observations
Contingency table
| observations | |||||||||
|---|---|---|---|---|---|---|---|---|---|
| open | c1 | c2 | c3 | c4 | c5 | c6 | |||
| m o d e l |
open | 0 | 0 | 0 | 0 | 0 | 0 | 0 | |
| c1 | 0 | 0.003 | 0.035 | 0.066 | 0.015 | 0.006 | 0.003 | ||
| c2 | 0 | 0.003 | 0.025 | 0.128 | 0.166 | 0.062 | 0.01 | ||
| c3 | 0 | 0 | 0.005 | 0.053 | 0.115 | 0.085 | 0.019 | ||
| c4 | 0 | 0 | 0.002 | 0.005 | 0.041 | 0.059 | 0.009 | ||
| c5 | 0 | 0 | 0 | 0.001 | 0.008 | 0.028 | 0.019 | ||
| c6 | 0 | 0 | 0 | 0.001 | 0.001 | 0.004 | 0.02 | ||
See category definitions for details.
Statistical distribution
|
|
Sea ice thickness, day 1 forecast

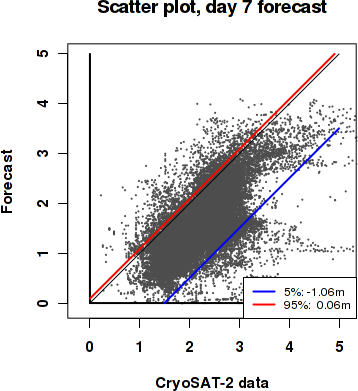
Day 7 forecast vs. observations
Contingency table
| observations | |||||||||
|---|---|---|---|---|---|---|---|---|---|
| open | c1 | c2 | c3 | c4 | c5 | c6 | |||
| m o d e l |
open | 0 | 0 | 0 | 0 | 0 | 0 | 0 | |
| c1 | 0 | 0.003 | 0.033 | 0.064 | 0.015 | 0.006 | 0.003 | ||
| c2 | 0 | 0.003 | 0.027 | 0.129 | 0.165 | 0.059 | 0.009 | ||
| c3 | 0 | 0 | 0.005 | 0.054 | 0.116 | 0.088 | 0.019 | ||
| c4 | 0 | 0 | 0.002 | 0.005 | 0.041 | 0.059 | 0.009 | ||
| c5 | 0 | 0 | 0 | 0.001 | 0.009 | 0.028 | 0.018 | ||
| c6 | 0 | 0 | 0 | 0 | 0.002 | 0.004 | 0.021 | ||
See category definitions for details.
Statistical distribution

|
|
Sea ice thickness, day 7 forecast
Generated by /metno/routine/sms/V2/SIthickness/c2iceWebPage.sh on. 25. okt. 12:38:20 +0000 2017 on arcmfcval