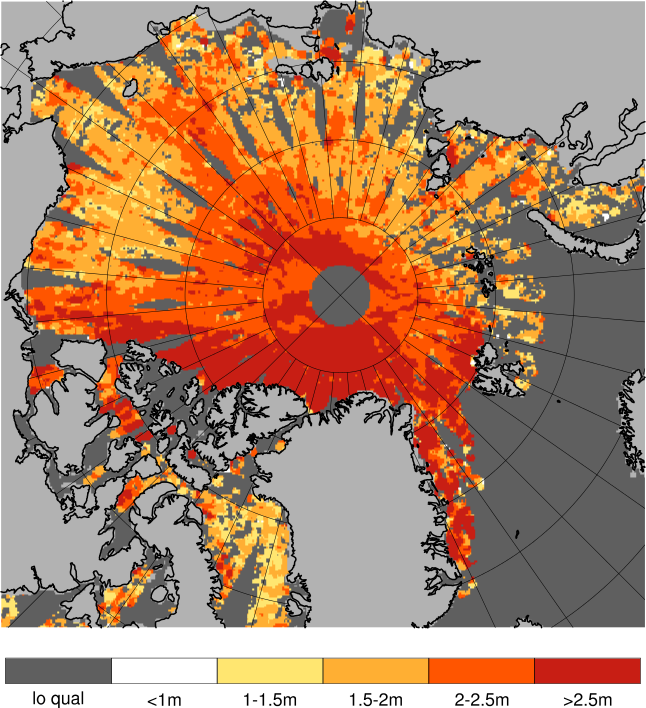
Validation of ice thickness - Full domain
Bulletin date: 2017-04-06
Model: ARC MFC - TOPAZ
Data source: UCL CryoSAT-2 sea ice thickness
Validation statistics summary
| Bias (m) | RMS (m) | total grids | low SIT | OK SIT | high SIT | |
|---|---|---|---|---|---|---|
| Best estimate | -0.75 | 0.95 | 48351 | 16260 | 31870 | 221 |
| Day 1 forecast | -0.76 | 0.95 | 48351 | 16337 | 31811 | 203 |
| Day 4 forecast | -0.76 | 0.96 | 48351 | 16561 | 31575 | 215 |
| Day 7 forecast | -0.75 | 0.95 | 48351 | 16046 | 32092 | 213 |
| Day 10 forecast | -0.77 | 0.97 | 48351 | 17034 | 31083 | 234 |
Numbers in the three rightmost columns are grid counts. Regions with high/low sea ice thickness correspond to areas with model offsets from the gridded observations outside of one standard deviation. (Standard deviations are provided in the observational product.)
Definition of categories:
| Category | Sea ice thickness |
|---|---|
| c1 | <1m |
| c2 | 1 - 1.5m |
| c3 | 1.5 - 2m |
| c4 | 2 - 2.5m |
| c5 | 2.5 - 3m |
| c6 | >3m |
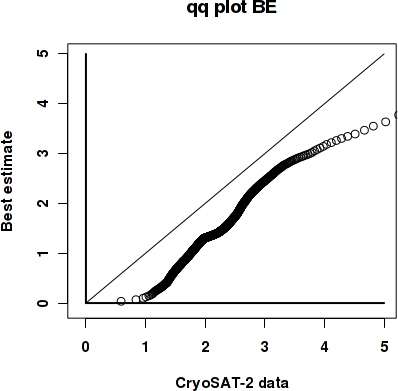
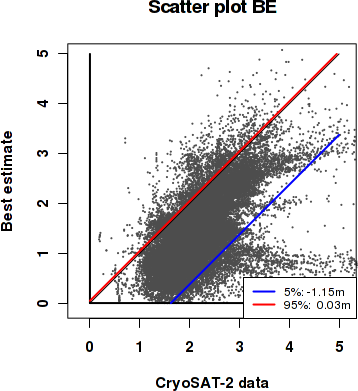
Best estimate vs. observations
Contingency table
| observations | |||||||||
|---|---|---|---|---|---|---|---|---|---|
| open | c1 | c2 | c3 | c4 | c5 | c6 | |||
| m o d e l |
open | 0 | 0 | 0 | 0 | 0 | 0 | 0 | |
| c1 | 0 | 0.003 | 0.059 | 0.137 | 0.042 | 0.012 | 0.012 | ||
| c2 | 0 | 0.001 | 0.022 | 0.161 | 0.165 | 0.044 | 0.006 | ||
| c3 | 0 | 0 | 0.008 | 0.05 | 0.076 | 0.036 | 0.004 | ||
| c4 | 0 | 0 | 0.001 | 0.004 | 0.034 | 0.042 | 0.014 | ||
| c5 | 0 | 0 | 0 | 0.002 | 0.006 | 0.017 | 0.025 | ||
| c6 | 0 | 0 | 0 | 0 | 0.001 | 0.003 | 0.013 | ||
See category definitions for details.
Statistical distribution
|
|
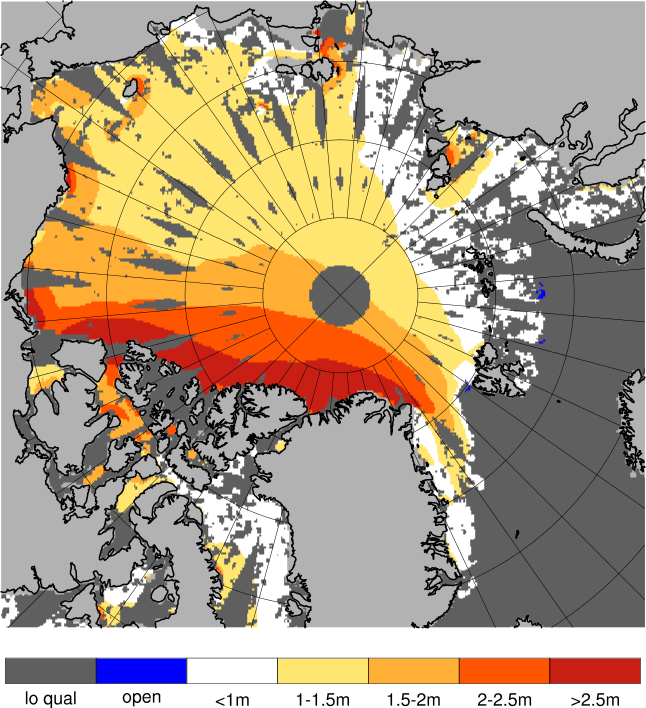
Observed sea ice thickness from CryoSAT
Sea ice thickness, best estimate product

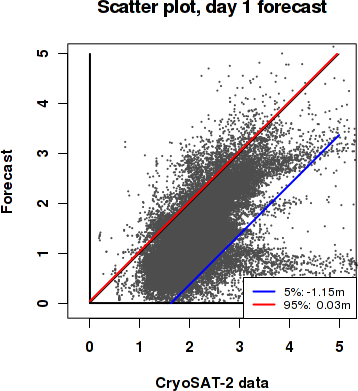
Day 1 forecast vs. observations
Contingency table
| observations | |||||||||
|---|---|---|---|---|---|---|---|---|---|
| open | c1 | c2 | c3 | c4 | c5 | c6 | |||
| m o d e l |
open | 0 | 0 | 0 | 0 | 0 | 0 | 0 | |
| c1 | 0 | 0.003 | 0.059 | 0.138 | 0.042 | 0.013 | 0.013 | ||
| c2 | 0 | 0.001 | 0.022 | 0.163 | 0.165 | 0.044 | 0.006 | ||
| c3 | 0 | 0 | 0.008 | 0.048 | 0.076 | 0.035 | 0.004 | ||
| c4 | 0 | 0 | 0.001 | 0.004 | 0.034 | 0.042 | 0.014 | ||
| c5 | 0 | 0 | 0 | 0.002 | 0.006 | 0.016 | 0.024 | ||
| c6 | 0 | 0 | 0 | 0 | 0.001 | 0.003 | 0.013 | ||
See category definitions for details.
Statistical distribution

|
|
Sea ice thickness, day 1 forecast
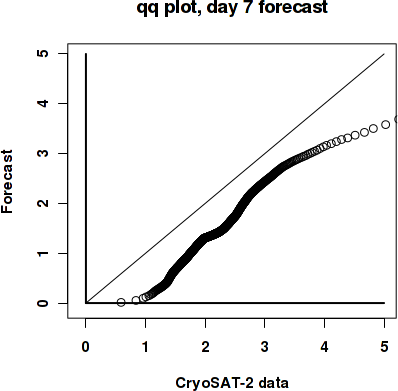
Day 7 forecast vs. observations
Contingency table
| observations | |||||||||
|---|---|---|---|---|---|---|---|---|---|
| open | c1 | c2 | c3 | c4 | c5 | c6 | |||
| m o d e l |
open | 0 | 0 | 0 | 0 | 0 | 0 | 0 | |
| c1 | 0 | 0.003 | 0.059 | 0.135 | 0.041 | 0.012 | 0.012 | ||
| c2 | 0 | 0.001 | 0.022 | 0.163 | 0.166 | 0.044 | 0.006 | ||
| c3 | 0 | 0 | 0.008 | 0.05 | 0.075 | 0.036 | 0.004 | ||
| c4 | 0 | 0 | 0.001 | 0.004 | 0.035 | 0.042 | 0.015 | ||
| c5 | 0 | 0 | 0 | 0.002 | 0.006 | 0.016 | 0.023 | ||
| c6 | 0 | 0 | 0 | 0 | 0.001 | 0.003 | 0.013 | ||
See category definitions for details.
Statistical distribution
|

|
Sea ice thickness, day 7 forecast

Generated by /metno/routine/sms/V2/SIthickness/c2iceWebPage.sh on. 25. okt. 12:31:23 +0000 2017 on arcmfcval