Validation of ice thickness - Full domain
Bulletin date: 2017-03-30
Model: ARC MFC - TOPAZ
Data source: UCL CryoSAT-2 sea ice thickness
Validation statistics summary
| Bias (m) | RMS (m) | total grids | low SIT | OK SIT | high SIT | |
|---|---|---|---|---|---|---|
| Best estimate | -0.76 | 0.96 | 44545 | 16265 | 27989 | 291 |
| Day 1 forecast | -0.77 | 0.96 | 44545 | 16331 | 27936 | 278 |
| Day 4 forecast | -0.77 | 0.97 | 44545 | 16471 | 27804 | 270 |
| Day 7 forecast | -0.76 | 0.96 | 44545 | 16200 | 28072 | 273 |
| Day 10 forecast | -0.78 | 0.98 | 44545 | 16567 | 27703 | 275 |
Numbers in the three rightmost columns are grid counts. Regions with high/low sea ice thickness correspond to areas with model offsets from the gridded observations outside of one standard deviation. (Standard deviations are provided in the observational product.)
Definition of categories:
| Category | Sea ice thickness |
|---|---|
| c1 | <1m |
| c2 | 1 - 1.5m |
| c3 | 1.5 - 2m |
| c4 | 2 - 2.5m |
| c5 | 2.5 - 3m |
| c6 | >3m |
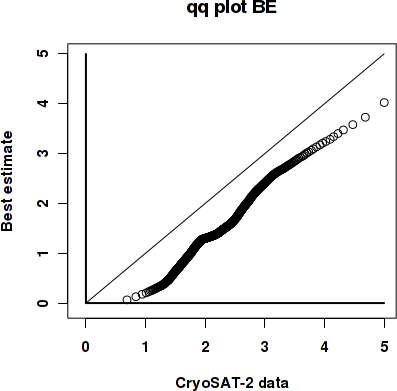
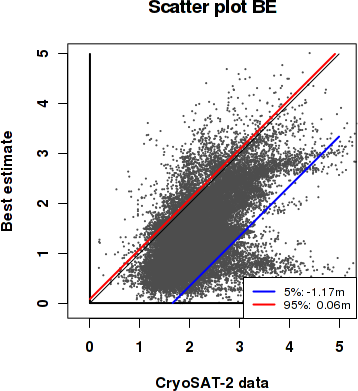
Best estimate vs. observations
Contingency table
| observations | |||||||||
|---|---|---|---|---|---|---|---|---|---|
| open | c1 | c2 | c3 | c4 | c5 | c6 | |||
| m o d e l |
open | 0 | 0 | 0 | 0 | 0 | 0 | 0 | |
| c1 | 0 | 0.003 | 0.053 | 0.135 | 0.05 | 0.015 | 0.015 | ||
| c2 | 0 | 0.001 | 0.027 | 0.175 | 0.146 | 0.057 | 0.005 | ||
| c3 | 0 | 0 | 0.009 | 0.052 | 0.066 | 0.033 | 0.005 | ||
| c4 | 0 | 0 | 0.001 | 0.008 | 0.029 | 0.035 | 0.016 | ||
| c5 | 0 | 0 | 0 | 0.003 | 0.006 | 0.014 | 0.025 | ||
| c6 | 0 | 0 | 0 | 0 | 0.002 | 0.003 | 0.011 | ||
See category definitions for details.
Statistical distribution
|
|
Observed sea ice thickness from CryoSAT
Sea ice thickness, best estimate product

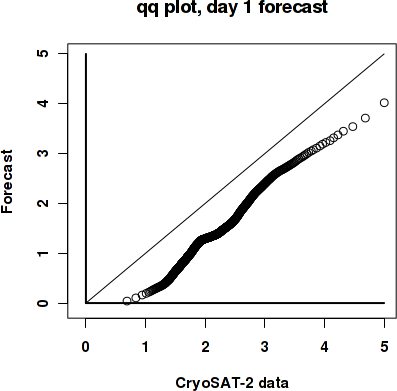
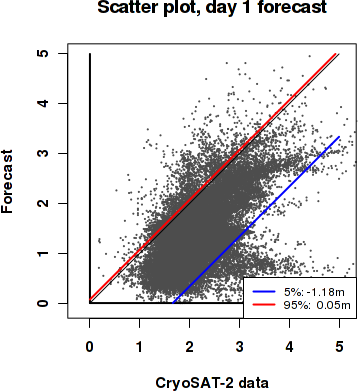
Day 1 forecast vs. observations
Contingency table
| observations | |||||||||
|---|---|---|---|---|---|---|---|---|---|
| open | c1 | c2 | c3 | c4 | c5 | c6 | |||
| m o d e l |
open | 0 | 0 | 0 | 0 | 0 | 0 | 0 | |
| c1 | 0 | 0.003 | 0.053 | 0.136 | 0.051 | 0.015 | 0.015 | ||
| c2 | 0 | 0.001 | 0.027 | 0.175 | 0.146 | 0.057 | 0.005 | ||
| c3 | 0 | 0 | 0.009 | 0.051 | 0.066 | 0.033 | 0.005 | ||
| c4 | 0 | 0 | 0.001 | 0.008 | 0.028 | 0.035 | 0.017 | ||
| c5 | 0 | 0 | 0 | 0.003 | 0.006 | 0.013 | 0.025 | ||
| c6 | 0 | 0 | 0 | 0 | 0.002 | 0.003 | 0.011 | ||
See category definitions for details.
Statistical distribution
|
|
Sea ice thickness, day 1 forecast

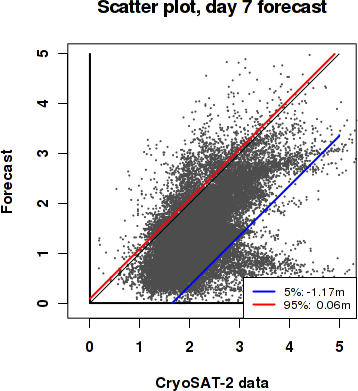
Day 7 forecast vs. observations
Contingency table
| observations | |||||||||
|---|---|---|---|---|---|---|---|---|---|
| open | c1 | c2 | c3 | c4 | c5 | c6 | |||
| m o d e l |
open | 0 | 0 | 0 | 0 | 0 | 0 | 0 | |
| c1 | 0 | 0.003 | 0.053 | 0.135 | 0.049 | 0.014 | 0.014 | ||
| c2 | 0 | 0.001 | 0.027 | 0.174 | 0.148 | 0.056 | 0.005 | ||
| c3 | 0 | 0 | 0.009 | 0.052 | 0.066 | 0.034 | 0.005 | ||
| c4 | 0 | 0 | 0.001 | 0.008 | 0.029 | 0.035 | 0.017 | ||
| c5 | 0 | 0 | 0 | 0.003 | 0.006 | 0.013 | 0.023 | ||
| c6 | 0 | 0 | 0 | 0 | 0.002 | 0.003 | 0.012 | ||
See category definitions for details.
Statistical distribution

|
|
Sea ice thickness, day 7 forecast
Generated by /metno/routine/sms/V2/SIthickness/c2iceWebPage.sh on. 25. okt. 12:30:11 +0000 2017 on arcmfcval