Validation of ice thickness - Full domain
Bulletin date: 2017-03-23
Model: ARC MFC - TOPAZ
Data source: UCL CryoSAT-2 sea ice thickness
Validation statistics summary
| Bias (m) | RMS (m) | total grids | low SIT | OK SIT | high SIT | |
|---|---|---|---|---|---|---|
| Best estimate | -0.78 | 0.99 | 49477 | 17924 | 31358 | 195 |
| Day 1 forecast | -0.79 | 0.99 | 49477 | 18030 | 31258 | 189 |
| Day 4 forecast | -0.79 | 0.99 | 49477 | 18152 | 31151 | 174 |
| Day 7 forecast | -0.78 | 0.99 | 49477 | 18016 | 31243 | 218 |
| Day 10 forecast | -0.8 | 1 | 49477 | 18104 | 31234 | 139 |
Numbers in the three rightmost columns are grid counts. Regions with high/low sea ice thickness correspond to areas with model offsets from the gridded observations outside of one standard deviation. (Standard deviations are provided in the observational product.)
Definition of categories:
| Category | Sea ice thickness |
|---|---|
| c1 | <1m |
| c2 | 1 - 1.5m |
| c3 | 1.5 - 2m |
| c4 | 2 - 2.5m |
| c5 | 2.5 - 3m |
| c6 | >3m |
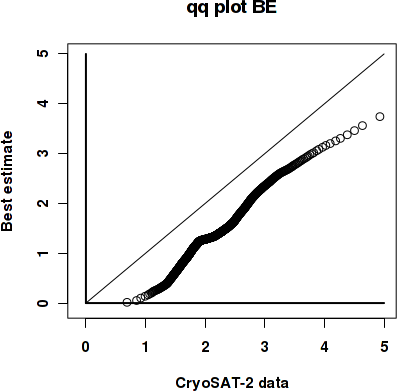
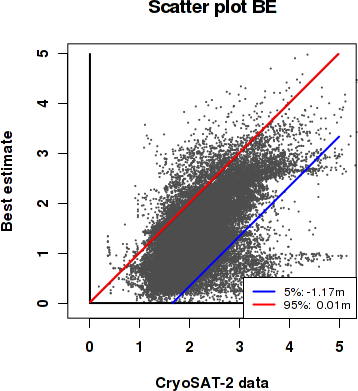
Best estimate vs. observations
Contingency table
| observations | |||||||||
|---|---|---|---|---|---|---|---|---|---|
| open | c1 | c2 | c3 | c4 | c5 | c6 | |||
| m o d e l |
open | 0 | 0 | 0 | 0 | 0 | 0 | 0 | |
| c1 | 0 | 0.003 | 0.059 | 0.139 | 0.046 | 0.015 | 0.014 | ||
| c2 | 0 | 0.001 | 0.026 | 0.189 | 0.145 | 0.056 | 0.006 | ||
| c3 | 0 | 0 | 0.005 | 0.043 | 0.07 | 0.033 | 0.005 | ||
| c4 | 0 | 0 | 0.001 | 0.006 | 0.028 | 0.033 | 0.018 | ||
| c5 | 0 | 0 | 0 | 0.002 | 0.005 | 0.011 | 0.026 | ||
| c6 | 0 | 0 | 0 | 0 | 0.002 | 0.002 | 0.009 | ||
See category definitions for details.
Statistical distribution
|
|
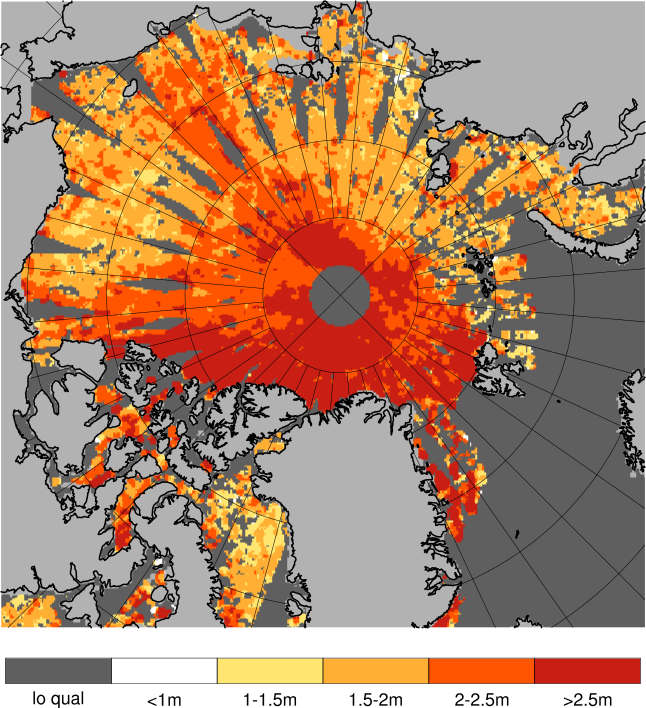
Observed sea ice thickness from CryoSAT
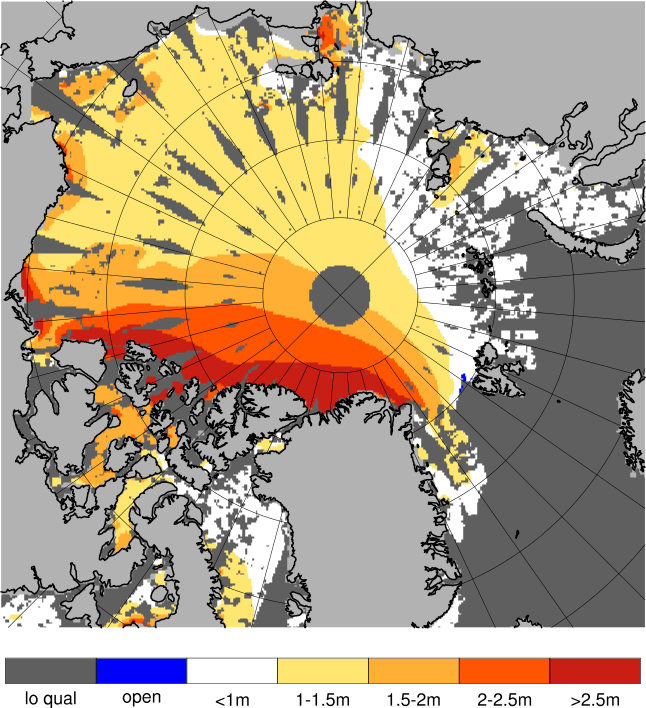
Sea ice thickness, best estimate product
Day 1 forecast vs. observations
Contingency table
| observations | |||||||||
|---|---|---|---|---|---|---|---|---|---|
| open | c1 | c2 | c3 | c4 | c5 | c6 | |||
| m o d e l |
open | 0 | 0 | 0 | 0 | 0 | 0 | 0.001 | |
| c1 | 0 | 0.003 | 0.06 | 0.14 | 0.046 | 0.016 | 0.014 | ||
| c2 | 0 | 0.001 | 0.026 | 0.189 | 0.146 | 0.055 | 0.006 | ||
| c3 | 0 | 0 | 0.005 | 0.042 | 0.069 | 0.034 | 0.006 | ||
| c4 | 0 | 0 | 0.001 | 0.006 | 0.028 | 0.033 | 0.018 | ||
| c5 | 0 | 0 | 0 | 0.002 | 0.005 | 0.01 | 0.025 | ||
| c6 | 0 | 0 | 0 | 0 | 0.001 | 0.002 | 0.009 | ||
See category definitions for details.
Statistical distribution
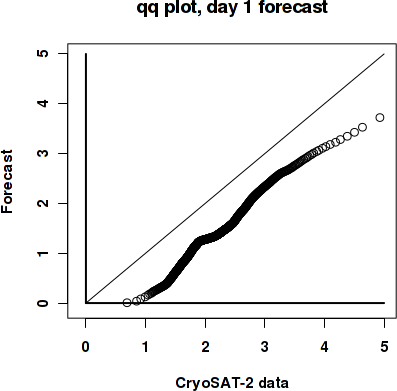
|
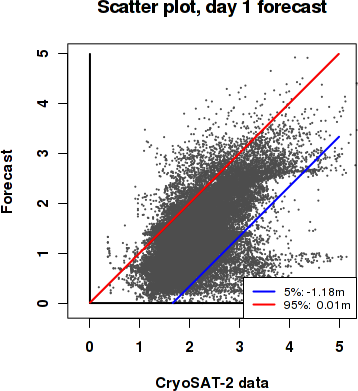
|
Sea ice thickness, day 1 forecast

Day 7 forecast vs. observations
Contingency table
| observations | |||||||||
|---|---|---|---|---|---|---|---|---|---|
| open | c1 | c2 | c3 | c4 | c5 | c6 | |||
| m o d e l |
open | 0 | 0 | 0 | 0 | 0 | 0 | 0.001 | |
| c1 | 0 | 0.003 | 0.059 | 0.139 | 0.046 | 0.015 | 0.014 | ||
| c2 | 0 | 0.001 | 0.026 | 0.189 | 0.147 | 0.054 | 0.006 | ||
| c3 | 0 | 0 | 0.005 | 0.042 | 0.068 | 0.034 | 0.005 | ||
| c4 | 0 | 0 | 0.001 | 0.006 | 0.027 | 0.033 | 0.017 | ||
| c5 | 0 | 0 | 0 | 0.002 | 0.006 | 0.011 | 0.025 | ||
| c6 | 0 | 0 | 0 | 0.001 | 0.002 | 0.002 | 0.011 | ||
See category definitions for details.
Statistical distribution

|
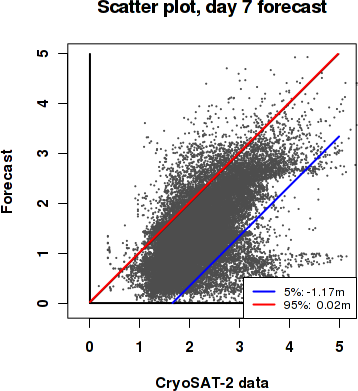
|
Sea ice thickness, day 7 forecast

Generated by /metno/routine/sms/V2/SIthickness/c2iceWebPage.sh on. 25. okt. 12:28:58 +0000 2017 on arcmfcval