Validation of ice thickness - Full domain
Bulletin date: 2017-03-16
Model: ARC MFC - TOPAZ
Data source: UCL CryoSAT-2 sea ice thickness
Validation statistics summary
| Bias (m) | RMS (m) | total grids | low SIT | OK SIT | high SIT | |
|---|---|---|---|---|---|---|
| Best estimate | -0.81 | 1.01 | 49251 | 18764 | 30394 | 93 |
| Day 1 forecast | -0.82 | 1.02 | 49251 | 18910 | 30251 | 90 |
| Day 4 forecast | -0.82 | 1.02 | 49251 | 19142 | 30029 | 80 |
| Day 7 forecast | -0.81 | 1.01 | 49251 | 18597 | 30554 | 100 |
| Day 10 forecast | -0.83 | 1.03 | 49251 | 19497 | 29681 | 73 |
Numbers in the three rightmost columns are grid counts. Regions with high/low sea ice thickness correspond to areas with model offsets from the gridded observations outside of one standard deviation. (Standard deviations are provided in the observational product.)
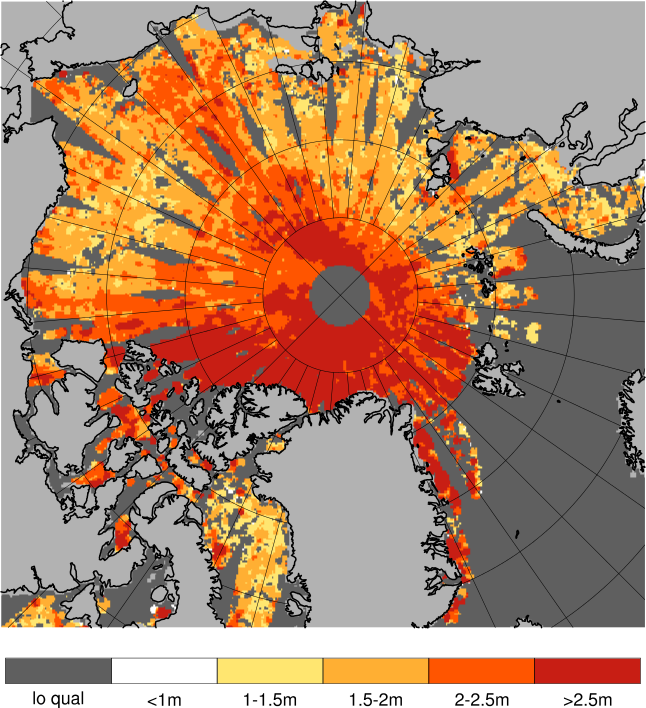
Definition of categories:
| Category | Sea ice thickness |
|---|---|
| c1 | <1m |
| c2 | 1 - 1.5m |
| c3 | 1.5 - 2m |
| c4 | 2 - 2.5m |
| c5 | 2.5 - 3m |
| c6 | >3m |
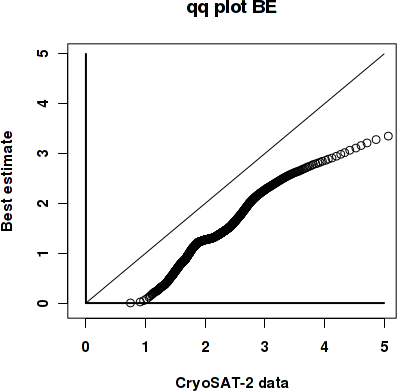
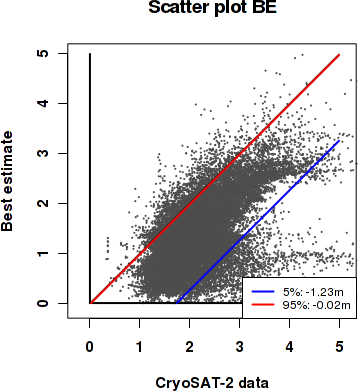
Best estimate vs. observations
Contingency table
| observations | |||||||||
|---|---|---|---|---|---|---|---|---|---|
| open | c1 | c2 | c3 | c4 | c5 | c6 | |||
| m o d e l |
open | 0 | 0 | 0 | 0 | 0.001 | 0 | 0 | |
| c1 | 0 | 0.003 | 0.073 | 0.142 | 0.043 | 0.019 | 0.015 | ||
| c2 | 0 | 0.001 | 0.035 | 0.186 | 0.139 | 0.053 | 0.006 | ||
| c3 | 0 | 0 | 0.004 | 0.044 | 0.063 | 0.033 | 0.004 | ||
| c4 | 0 | 0 | 0.001 | 0.005 | 0.027 | 0.031 | 0.022 | ||
| c5 | 0 | 0 | 0 | 0 | 0.004 | 0.008 | 0.026 | ||
| c6 | 0 | 0 | 0 | 0 | 0.001 | 0.001 | 0.008 | ||
See category definitions for details.
Statistical distribution
|
|
Observed sea ice thickness from CryoSAT
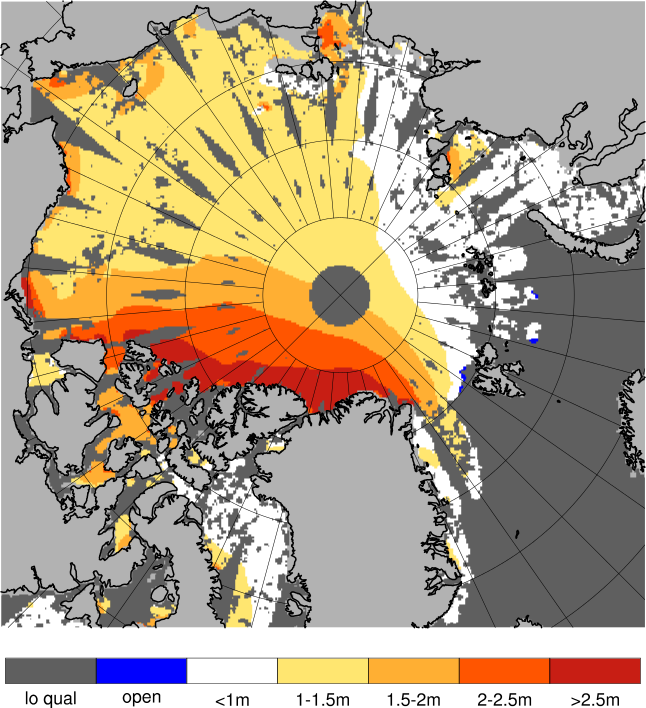
Sea ice thickness, best estimate product

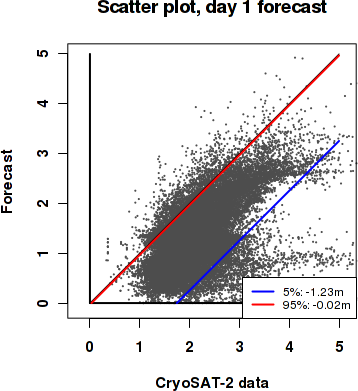
Day 1 forecast vs. observations
Contingency table
| observations | |||||||||
|---|---|---|---|---|---|---|---|---|---|
| open | c1 | c2 | c3 | c4 | c5 | c6 | |||
| m o d e l |
open | 0 | 0 | 0 | 0 | 0.001 | 0 | 0 | |
| c1 | 0 | 0.003 | 0.073 | 0.142 | 0.044 | 0.019 | 0.015 | ||
| c2 | 0 | 0.001 | 0.036 | 0.189 | 0.141 | 0.052 | 0.006 | ||
| c3 | 0 | 0 | 0.004 | 0.041 | 0.062 | 0.034 | 0.004 | ||
| c4 | 0 | 0 | 0 | 0.005 | 0.027 | 0.031 | 0.023 | ||
| c5 | 0 | 0 | 0 | 0 | 0.003 | 0.008 | 0.025 | ||
| c6 | 0 | 0 | 0 | 0 | 0.001 | 0.001 | 0.008 | ||
See category definitions for details.
Statistical distribution

|
|
Sea ice thickness, day 1 forecast
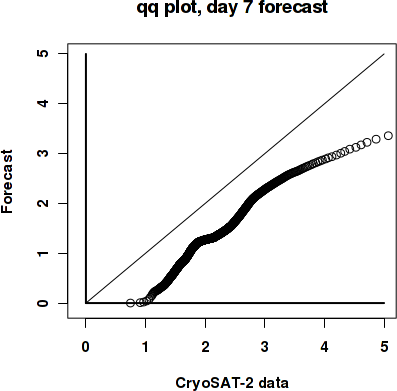
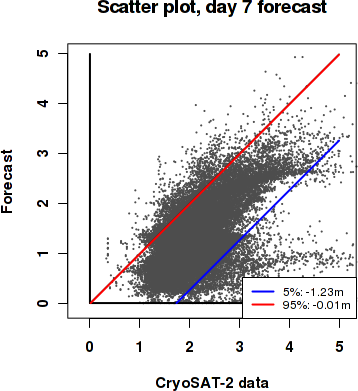
Day 7 forecast vs. observations
Contingency table
| observations | |||||||||
|---|---|---|---|---|---|---|---|---|---|
| open | c1 | c2 | c3 | c4 | c5 | c6 | |||
| m o d e l |
open | 0 | 0 | 0 | 0.001 | 0.001 | 0 | 0 | |
| c1 | 0 | 0.003 | 0.073 | 0.142 | 0.043 | 0.018 | 0.015 | ||
| c2 | 0 | 0.001 | 0.035 | 0.186 | 0.141 | 0.053 | 0.006 | ||
| c3 | 0 | 0 | 0.005 | 0.044 | 0.061 | 0.033 | 0.004 | ||
| c4 | 0 | 0 | 0.001 | 0.005 | 0.027 | 0.032 | 0.023 | ||
| c5 | 0 | 0 | 0 | 0 | 0.005 | 0.008 | 0.025 | ||
| c6 | 0 | 0 | 0 | 0 | 0.001 | 0.001 | 0.008 | ||
See category definitions for details.
Statistical distribution
|
|
Sea ice thickness, day 7 forecast

Generated by /metno/routine/sms/V2/SIthickness/c2iceWebPage.sh on. 25. okt. 12:27:42 +0000 2017 on arcmfcval