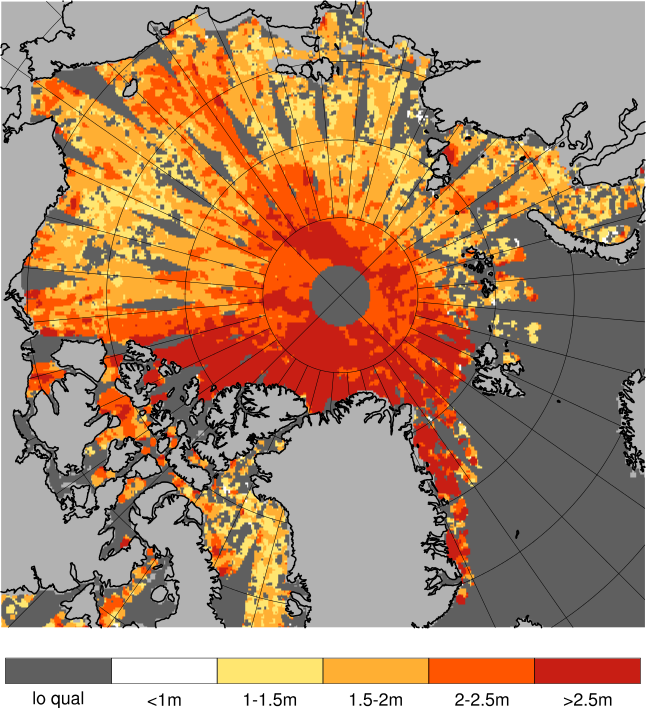
Validation of ice thickness - Full domain
Bulletin date: 2017-03-09
Model: ARC MFC - TOPAZ
Data source: UCL CryoSAT-2 sea ice thickness
Validation statistics summary
| Bias (m) | RMS (m) | total grids | low SIT | OK SIT | high SIT | |
|---|---|---|---|---|---|---|
| Best estimate | -0.77 | 0.99 | 48723 | 17770 | 30882 | 71 |
| Day 1 forecast | -0.78 | 0.99 | 48723 | 17902 | 30743 | 78 |
| Day 4 forecast | -0.79 | 1 | 48723 | 18211 | 30439 | 73 |
| Day 7 forecast | -0.77 | 0.99 | 48723 | 17562 | 31086 | 75 |
| Day 10 forecast | -0.8 | 1.01 | 48723 | 18579 | 30067 | 77 |
Numbers in the three rightmost columns are grid counts. Regions with high/low sea ice thickness correspond to areas with model offsets from the gridded observations outside of one standard deviation. (Standard deviations are provided in the observational product.)
Definition of categories:
| Category | Sea ice thickness |
|---|---|
| c1 | <1m |
| c2 | 1 - 1.5m |
| c3 | 1.5 - 2m |
| c4 | 2 - 2.5m |
| c5 | 2.5 - 3m |
| c6 | >3m |
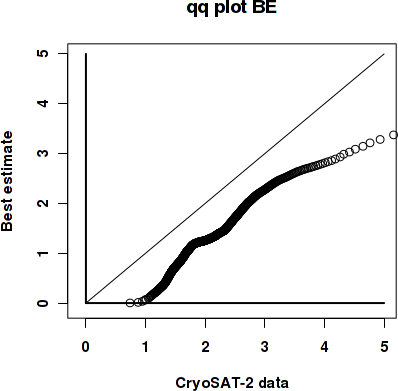
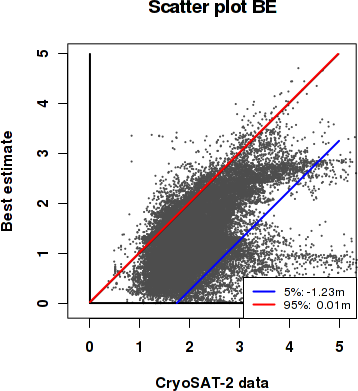
Best estimate vs. observations
Contingency table
| observations | |||||||||
|---|---|---|---|---|---|---|---|---|---|
| open | c1 | c2 | c3 | c4 | c5 | c6 | |||
| m o d e l |
open | 0 | 0 | 0.001 | 0 | 0 | 0 | 0 | |
| c1 | 0 | 0.004 | 0.081 | 0.138 | 0.049 | 0.016 | 0.014 | ||
| c2 | 0 | 0.001 | 0.065 | 0.202 | 0.125 | 0.038 | 0.007 | ||
| c3 | 0 | 0 | 0.005 | 0.049 | 0.048 | 0.028 | 0.003 | ||
| c4 | 0 | 0 | 0.001 | 0.007 | 0.027 | 0.029 | 0.018 | ||
| c5 | 0 | 0 | 0 | 0.001 | 0.003 | 0.007 | 0.025 | ||
| c6 | 0 | 0 | 0 | 0 | 0 | 0.001 | 0.007 | ||
See category definitions for details.
Statistical distribution
|
|
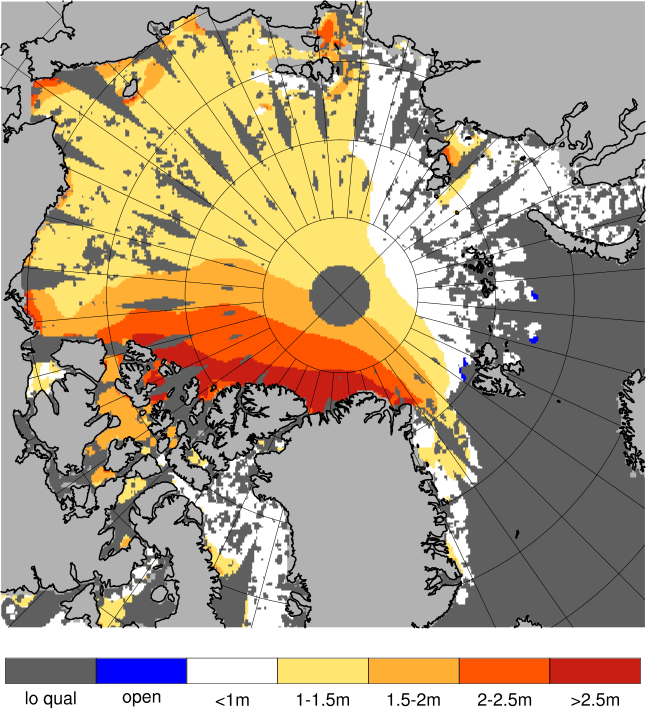
Observed sea ice thickness from CryoSAT
Sea ice thickness, best estimate product

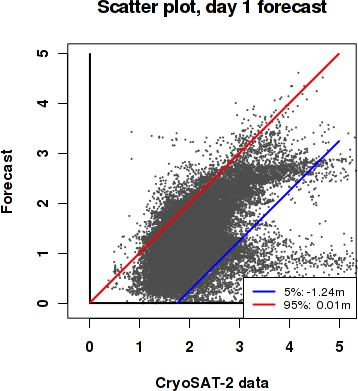
Day 1 forecast vs. observations
Contingency table
| observations | |||||||||
|---|---|---|---|---|---|---|---|---|---|
| open | c1 | c2 | c3 | c4 | c5 | c6 | |||
| m o d e l |
open | 0 | 0 | 0.001 | 0 | 0 | 0.001 | 0 | |
| c1 | 0 | 0.004 | 0.08 | 0.138 | 0.049 | 0.017 | 0.014 | ||
| c2 | 0 | 0.001 | 0.065 | 0.203 | 0.126 | 0.038 | 0.006 | ||
| c3 | 0 | 0 | 0.005 | 0.048 | 0.047 | 0.029 | 0.003 | ||
| c4 | 0 | 0 | 0.001 | 0.006 | 0.026 | 0.028 | 0.019 | ||
| c5 | 0 | 0 | 0 | 0.001 | 0.002 | 0.007 | 0.024 | ||
| c6 | 0 | 0 | 0 | 0 | 0 | 0.001 | 0.007 | ||
See category definitions for details.
Statistical distribution

|
|
Sea ice thickness, day 1 forecast
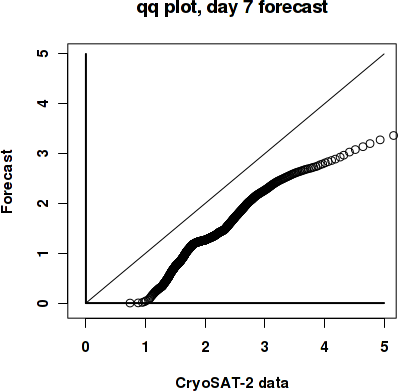
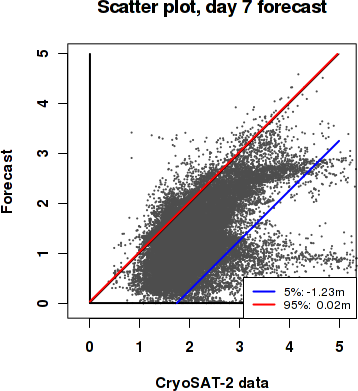
Day 7 forecast vs. observations
Contingency table
| observations | |||||||||
|---|---|---|---|---|---|---|---|---|---|
| open | c1 | c2 | c3 | c4 | c5 | c6 | |||
| m o d e l |
open | 0 | 0 | 0.001 | 0 | 0 | 0.001 | 0.001 | |
| c1 | 0 | 0.004 | 0.08 | 0.137 | 0.049 | 0.016 | 0.013 | ||
| c2 | 0 | 0.001 | 0.065 | 0.199 | 0.124 | 0.038 | 0.007 | ||
| c3 | 0 | 0 | 0.006 | 0.052 | 0.05 | 0.029 | 0.003 | ||
| c4 | 0 | 0 | 0.001 | 0.007 | 0.027 | 0.029 | 0.019 | ||
| c5 | 0 | 0 | 0 | 0.001 | 0.003 | 0.007 | 0.025 | ||
| c6 | 0 | 0 | 0 | 0 | 0 | 0.001 | 0.007 | ||
See category definitions for details.
Statistical distribution
|
|
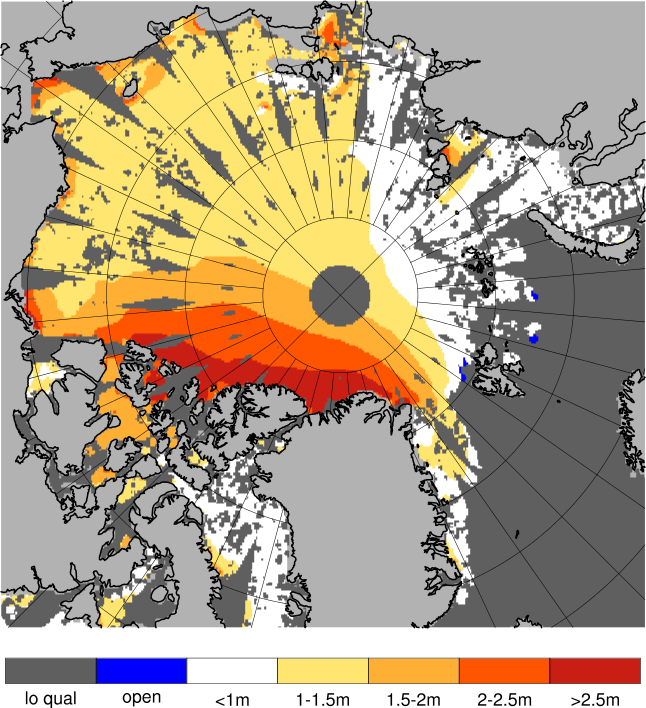
Sea ice thickness, day 7 forecast
Generated by /metno/routine/sms/V2/SIthickness/c2iceWebPage.sh on. 25. okt. 12:26:27 +0000 2017 on arcmfcval