Validation of ice thickness - Full domain
Bulletin date: 2017-03-02
Model: ARC MFC - TOPAZ
Data source: UCL CryoSAT-2 sea ice thickness
Validation statistics summary
| Bias (m) | RMS (m) | total grids | low SIT | OK SIT | high SIT | |
|---|---|---|---|---|---|---|
| Best estimate | -0.75 | 0.97 | 47427 | 17220 | 30114 | 93 |
| Day 1 forecast | -0.76 | 0.97 | 47427 | 17419 | 29913 | 95 |
| Day 4 forecast | -0.77 | 0.98 | 47427 | 17671 | 29662 | 94 |
| Day 7 forecast | -0.75 | 0.97 | 47427 | 17056 | 30280 | 91 |
| Day 10 forecast | -0.78 | 0.99 | 47427 | 17945 | 29374 | 108 |
Numbers in the three rightmost columns are grid counts. Regions with high/low sea ice thickness correspond to areas with model offsets from the gridded observations outside of one standard deviation. (Standard deviations are provided in the observational product.)
Definition of categories:
| Category | Sea ice thickness |
|---|---|
| c1 | <1m |
| c2 | 1 - 1.5m |
| c3 | 1.5 - 2m |
| c4 | 2 - 2.5m |
| c5 | 2.5 - 3m |
| c6 | >3m |
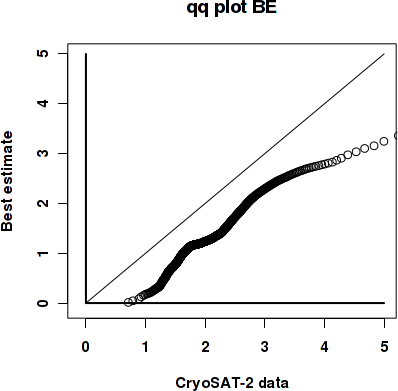
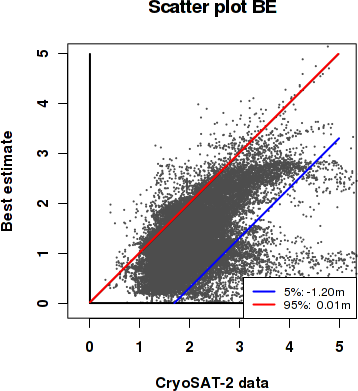
Best estimate vs. observations
Contingency table
| observations | |||||||||
|---|---|---|---|---|---|---|---|---|---|
| open | c1 | c2 | c3 | c4 | c5 | c6 | |||
| m o d e l |
open | 0 | 0 | 0 | 0 | 0 | 0 | 0 | |
| c1 | 0 | 0.006 | 0.091 | 0.135 | 0.048 | 0.017 | 0.012 | ||
| c2 | 0 | 0 | 0.089 | 0.209 | 0.113 | 0.03 | 0.006 | ||
| c3 | 0 | 0 | 0.005 | 0.052 | 0.044 | 0.023 | 0.003 | ||
| c4 | 0 | 0 | 0.001 | 0.004 | 0.024 | 0.028 | 0.017 | ||
| c5 | 0 | 0 | 0 | 0.001 | 0.002 | 0.008 | 0.023 | ||
| c6 | 0 | 0 | 0 | 0 | 0 | 0.001 | 0.006 | ||
See category definitions for details.
Statistical distribution
|
|
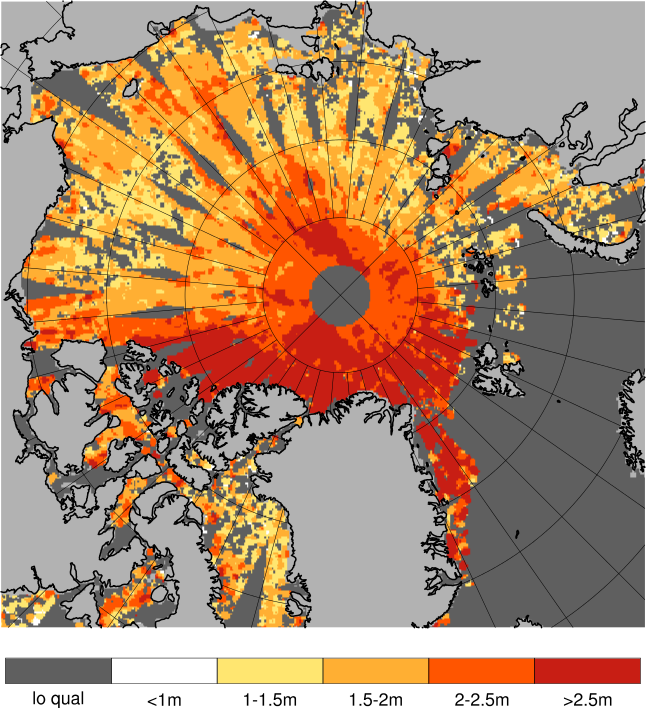
Observed sea ice thickness from CryoSAT
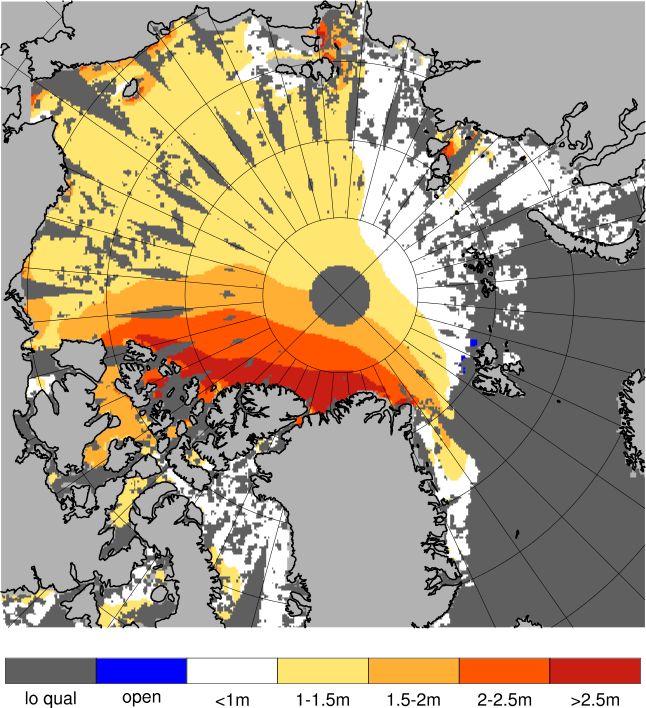
Sea ice thickness, best estimate product
Day 1 forecast vs. observations
Contingency table
| observations | |||||||||
|---|---|---|---|---|---|---|---|---|---|
| open | c1 | c2 | c3 | c4 | c5 | c6 | |||
| m o d e l |
open | 0 | 0 | 0 | 0 | 0 | 0 | 0.001 | |
| c1 | 0 | 0.006 | 0.092 | 0.136 | 0.049 | 0.018 | 0.012 | ||
| c2 | 0 | 0.001 | 0.089 | 0.208 | 0.113 | 0.03 | 0.007 | ||
| c3 | 0 | 0 | 0.005 | 0.052 | 0.044 | 0.023 | 0.003 | ||
| c4 | 0 | 0 | 0.001 | 0.004 | 0.023 | 0.027 | 0.018 | ||
| c5 | 0 | 0 | 0 | 0.001 | 0.001 | 0.007 | 0.022 | ||
| c6 | 0 | 0 | 0 | 0 | 0 | 0.001 | 0.006 | ||
See category definitions for details.
Statistical distribution
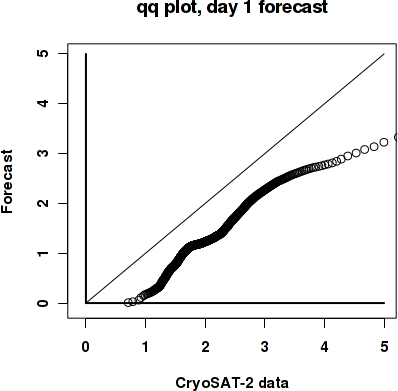
|
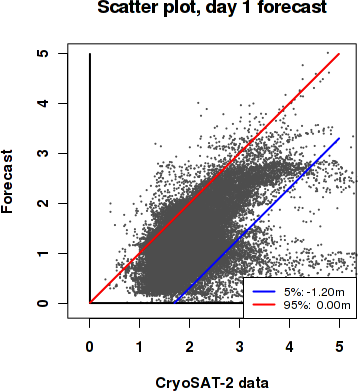
|
Sea ice thickness, day 1 forecast

Day 7 forecast vs. observations
Contingency table
| observations | |||||||||
|---|---|---|---|---|---|---|---|---|---|
| open | c1 | c2 | c3 | c4 | c5 | c6 | |||
| m o d e l |
open | 0 | 0 | 0 | 0 | 0 | 0 | 0.001 | |
| c1 | 0 | 0.006 | 0.09 | 0.133 | 0.047 | 0.018 | 0.012 | ||
| c2 | 0 | 0.001 | 0.09 | 0.209 | 0.113 | 0.03 | 0.007 | ||
| c3 | 0 | 0 | 0.005 | 0.054 | 0.046 | 0.023 | 0.003 | ||
| c4 | 0 | 0 | 0.001 | 0.005 | 0.024 | 0.027 | 0.017 | ||
| c5 | 0 | 0 | 0 | 0.001 | 0.001 | 0.007 | 0.023 | ||
| c6 | 0 | 0 | 0 | 0 | 0 | 0.001 | 0.006 | ||
See category definitions for details.
Statistical distribution

|
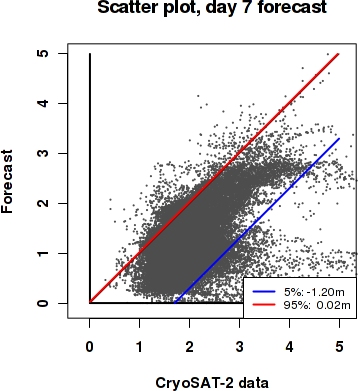
|
Sea ice thickness, day 7 forecast

Generated by /metno/routine/sms/V2/SIthickness/c2iceWebPage.sh on. 25. okt. 12:25:10 +0000 2017 on arcmfcval