Validation of ice thickness - Full domain
Bulletin date: 2017-02-09
Model: ARC MFC - TOPAZ
Data source: UCL CryoSAT-2 sea ice thickness
Validation statistics summary
| Bias (m) | RMS (m) | total grids | low SIT | OK SIT | high SIT | |
|---|---|---|---|---|---|---|
| Best estimate | -0.84 | 1.03 | 43321 | 17723 | 25514 | 84 |
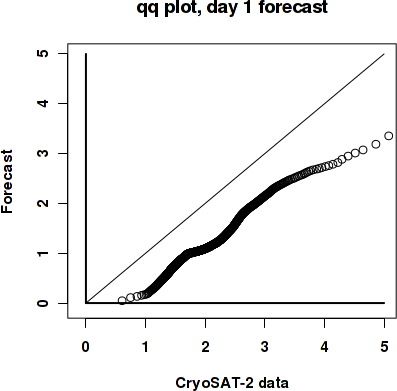
| Day 1 forecast | -0.85 | 1.03 | 43321 | 17888 | 25353 | 80 |
| Day 4 forecast | -0.85 | 1.04 | 43321 | 18113 | 25127 | 81 |
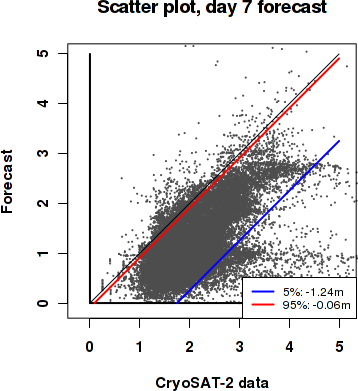
| Day 7 forecast | -0.83 | 1.02 | 43321 | 17623 | 25609 | 89 |
| Day 10 forecast | -0.86 | 1.04 | 43321 | 18269 | 24973 | 79 |
Numbers in the three rightmost columns are grid counts. Regions with high/low sea ice thickness correspond to areas with model offsets from the gridded observations outside of one standard deviation. (Standard deviations are provided in the observational product.)
Definition of categories:
| Category | Sea ice thickness |
|---|---|
| c1 | <1m |
| c2 | 1 - 1.5m |
| c3 | 1.5 - 2m |
| c4 | 2 - 2.5m |
| c5 | 2.5 - 3m |
| c6 | >3m |
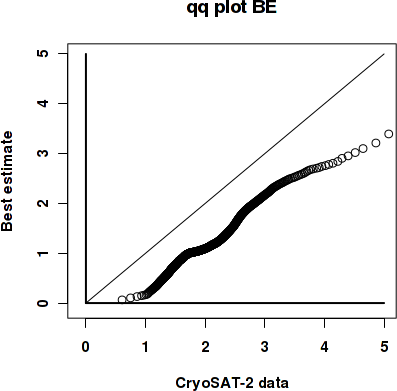
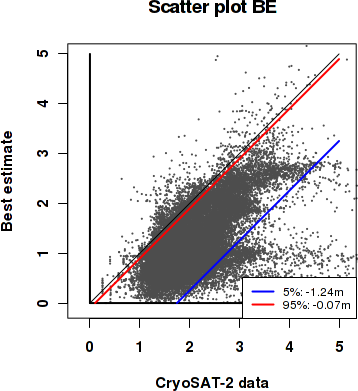
Best estimate vs. observations
Contingency table
| observations | |||||||||
|---|---|---|---|---|---|---|---|---|---|
| open | c1 | c2 | c3 | c4 | c5 | c6 | |||
| m o d e l |
open | 0 | 0 | 0 | 0 | 0 | 0 | 0 | |
| c1 | 0 | 0.006 | 0.145 | 0.157 | 0.067 | 0.024 | 0.014 | ||
| c2 | 0 | 0 | 0.062 | 0.177 | 0.095 | 0.027 | 0.007 | ||
| c3 | 0 | 0 | 0.004 | 0.028 | 0.035 | 0.034 | 0.01 | ||
| c4 | 0 | 0 | 0.001 | 0.003 | 0.021 | 0.032 | 0.016 | ||
| c5 | 0 | 0 | 0 | 0 | 0.001 | 0.005 | 0.02 | ||
| c6 | 0 | 0 | 0 | 0 | 0 | 0.001 | 0.005 | ||
See category definitions for details.
Statistical distribution
|
|
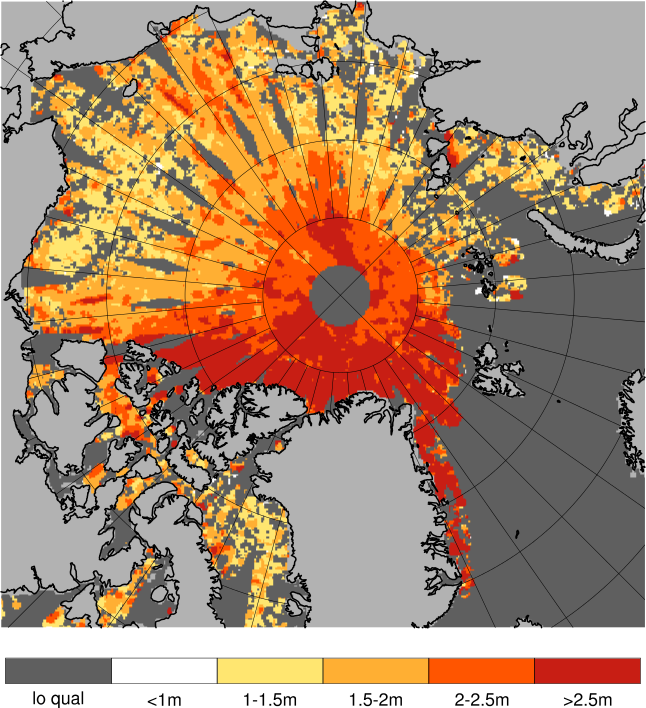
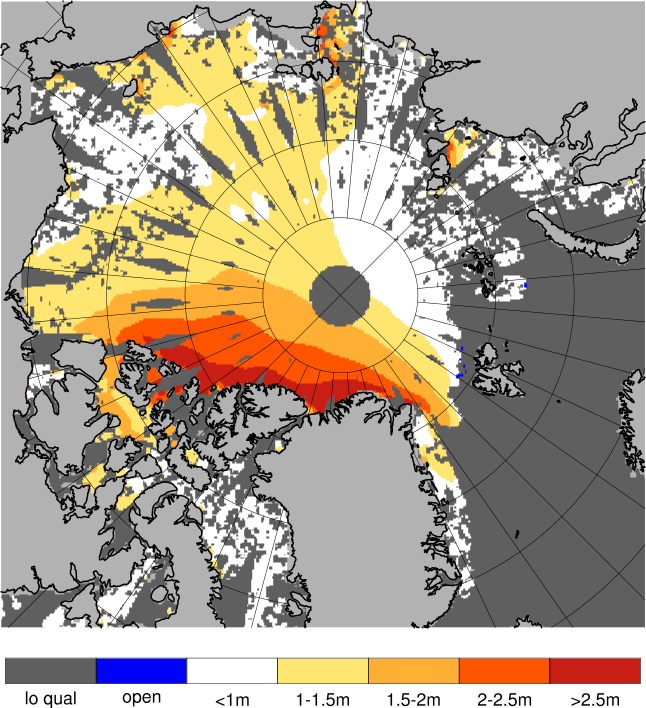
Observed sea ice thickness from CryoSAT
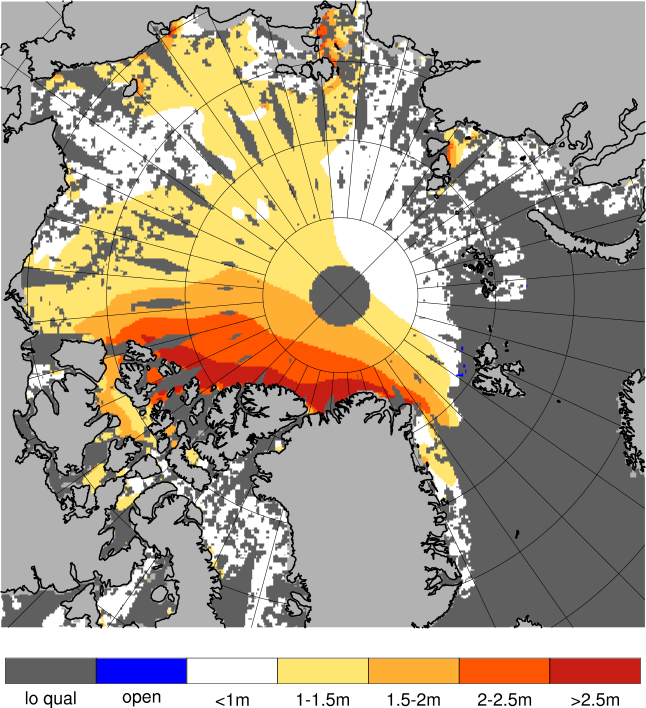
Sea ice thickness, best estimate product
Day 1 forecast vs. observations
Contingency table
| observations | |||||||||
|---|---|---|---|---|---|---|---|---|---|
| open | c1 | c2 | c3 | c4 | c5 | c6 | |||
| m o d e l |
open | 0 | 0 | 0 | 0 | 0 | 0 | 0 | |
| c1 | 0 | 0.006 | 0.144 | 0.159 | 0.071 | 0.025 | 0.015 | ||
| c2 | 0 | 0 | 0.063 | 0.176 | 0.092 | 0.026 | 0.006 | ||
| c3 | 0 | 0 | 0.004 | 0.028 | 0.036 | 0.036 | 0.011 | ||
| c4 | 0 | 0 | 0.001 | 0.003 | 0.019 | 0.031 | 0.016 | ||
| c5 | 0 | 0 | 0 | 0 | 0.001 | 0.005 | 0.019 | ||
| c6 | 0 | 0 | 0 | 0 | 0 | 0.001 | 0.005 | ||
See category definitions for details.
Statistical distribution
|

|
Sea ice thickness, day 1 forecast
Day 7 forecast vs. observations
Contingency table
| observations | |||||||||
|---|---|---|---|---|---|---|---|---|---|
| open | c1 | c2 | c3 | c4 | c5 | c6 | |||
| m o d e l |
open | 0 | 0 | 0 | 0 | 0 | 0 | 0 | |
| c1 | 0 | 0.006 | 0.139 | 0.149 | 0.065 | 0.025 | 0.015 | ||
| c2 | 0 | 0 | 0.067 | 0.183 | 0.097 | 0.028 | 0.006 | ||
| c3 | 0 | 0 | 0.005 | 0.031 | 0.036 | 0.035 | 0.011 | ||
| c4 | 0 | 0 | 0.001 | 0.003 | 0.02 | 0.03 | 0.016 | ||
| c5 | 0 | 0 | 0 | 0 | 0.001 | 0.005 | 0.02 | ||
| c6 | 0 | 0 | 0 | 0 | 0 | 0.001 | 0.006 | ||
See category definitions for details.
Statistical distribution

|
|
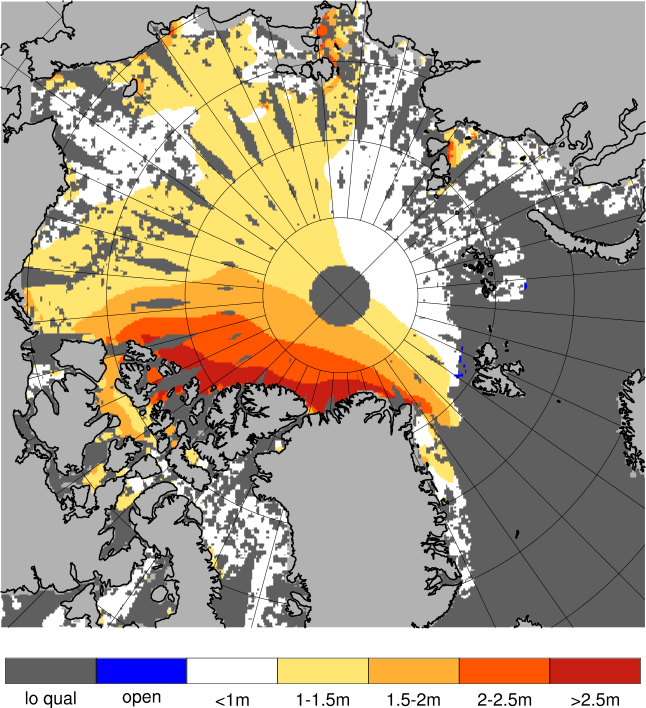
Sea ice thickness, day 7 forecast
Generated by /metno/routine/sms/V2/SIthickness/c2iceWebPage.sh on. 25. okt. 12:21:37 +0000 2017 on arcmfcval